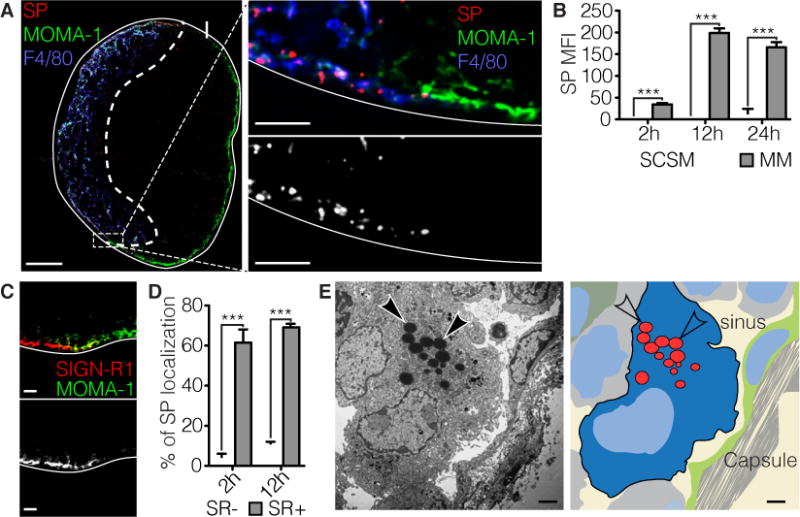
Figure 1. Capture of Streptococcus pneumonia (SP) is exclusive to the medulla.

a | Left: Confocal image of the popliteal lymph node (pLN) in a mouse immunized with SP (CMTPX, red) two hours prior. Subcapsular sinus (SCS) macrophages (MOMA-1, green) mark the SCS area, while medullary macrophages (F4/80, blue) mark the medullary region. Scale bar indicates 100 μm. Right: Magnification of the transition from medulla to SCS in which single cocci can be resolved. Gray scale image of the SP channel shows selective binding to the medulla. Scale bar indicates 10 μm. b | Quantification of (a) based on mean fluorescence intensity (MFI) of SP. Arrival and accumulation of SP in the medulla is gradual over the course of 12 hours. At two hours SP was detected in the medulla, in contrast to the SCS region were no binding was detected up to 24 hours. *** p<0.001 ANOVA with Tukey’s multiple comparisons test. c | Confocal micrograph of the medulla-SCS interface shows exclusive staining for SIGN-R1 (SR1, red) in the medulla. SCS is marked with MOMA-1 (green). Grey scale image of the SR1 channel. Scale bar indicates 10 μm. d | Quantification of (c) percentage out of total identified cocci. *** p<0.001 ANOVA with Tukey’s multiple comparisons test. e | Left: Electron micrograph of a medullary macrophage (MM) that has engulfed multiple SP (arrows), adjacent to the medullary sinus. Scale bar indicates 2 μm. Right: Color-coded overlay to aid in structure identification.
