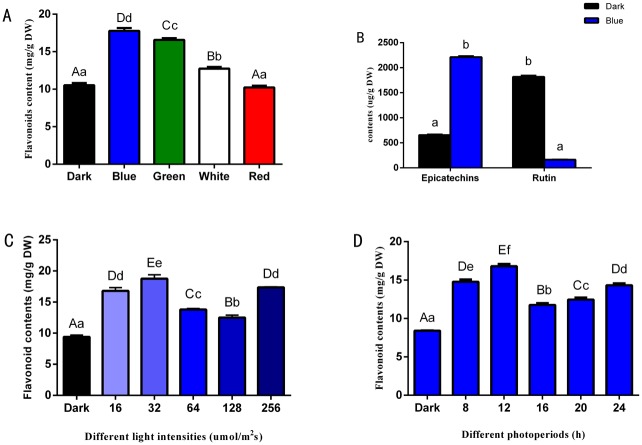
Fig 5. Flavonoid metabolites of longan ECs under different lighting conditions.
A, Flavonoid contents in longan ECs under different light qualities, at the light intensity of 32 μmol ·m-2 ·s-1 and photoperiod of 12h; B, Flavonoid compound contents of longan ECs under different light qualities, light intensity of 32 μmol ·m-2 ·s-1, at photoperiod of 12h/d; C, Flavonoid contents in longan ECs under blue light of different intensities, at photoperiod of 12h/d; D, Flavonoid contents in longan ECs under blue light of different photoperiods, at light intensity of 32 μmol ·m-2 ·s-1; Values represent means ± SDs of three replicates. Different upper/lower case letters indicate statistically significant difference at 0.01/0.05 levels by one-way ANOVA analysis in the duncan’s test.

