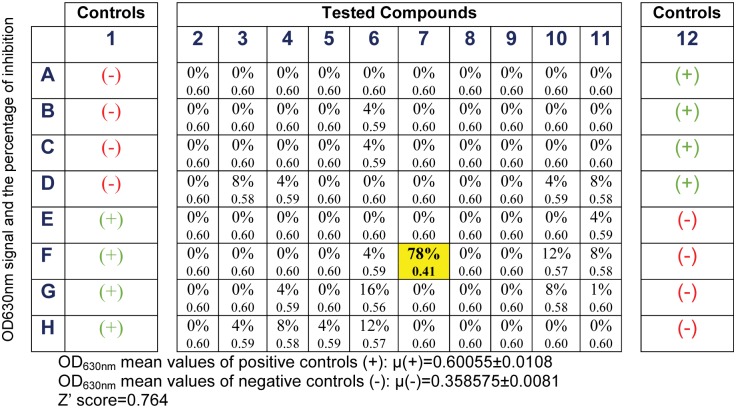
Fig 3. Representative results for one 96-well screening plate.
OD630nm values obtained with the malachite green ATPase assay. Columns 1 and 12 correspond to controls with LieIF (“+”; activity) or without LieIF (“-”; no activity). For each tested compound, the figure shows both the OD630nm signal and the percentage of inhibition relative to the control wells. Compounds inhibiting OD630nm signal are highlighted in yellow.

