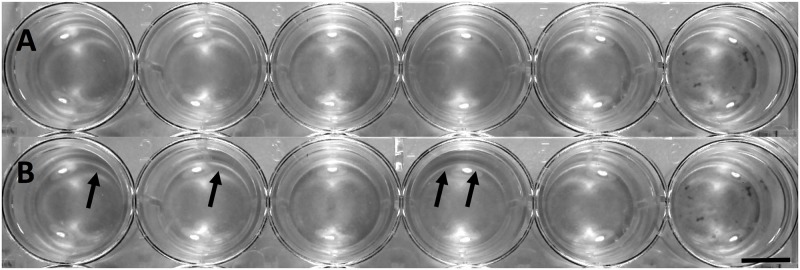
Fig 3. Well plate before and after light exposure.
Longitudinal wells in a modified 24-well plate before and after light exposure. Image A shows the plate before exposure, while image B was taken after light exposure. Black arrows indicate changes in algal density due to directional light exposure. Scale bar = 8mm.

