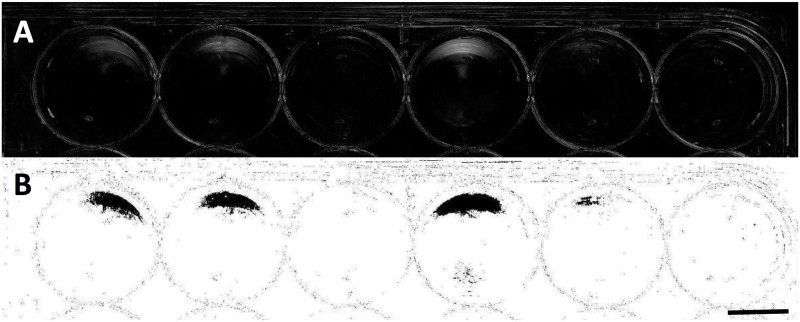
Fig 4. Well plate analysis in ImageJ.
Images from Fig 3 analyzed to indicate density differences in the plate before and after directional light exposure. Image A shows the ImageJ analysis showing the changes in density of green pixels between the before and after photographs, showing algal movement due to light exposure. Image B shows this same analysis image with a color threshold set to determine relative magnitude of algal movement. Strains analyzed here with their corresponding magnitude of pixel density change in grayscale units (from left to right) are: K107, 75.5; K108, 73.7; B505, 1.5; K105, 96.4; B501, 40.3; B207, 0.2. Scale bar = 8mm.

