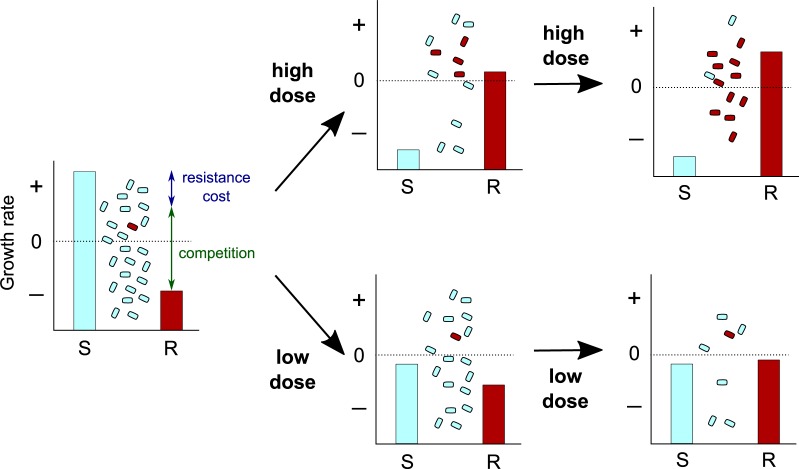
Fig 3. How high drug doses can lead to selection of preexisting drug-resistant mutants via 'competitive release'.
Charts show the within-host growth rate of drug-susceptible (in cyan) and -resistant (in red) bacteria populations at three time points using a high (top) or a low (bottom) drug dose. Population sizes and the fraction of resistant bacteria are shown between the bars. Note that depending on the fitness landscape, there might not always exist a dose that prevents the spread of both bacterial populations (for details, see [68]). R, Resistant; S, Susceptible.

