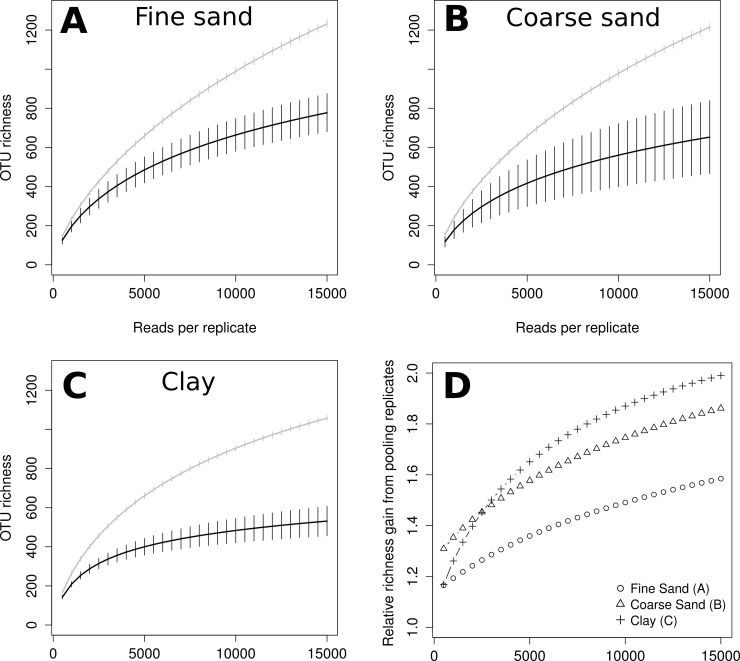
Fig 3. Rarefaction comparing expected OTU richness of pooled samples (grey lines) and individual replicates (black lines).
Only replicates with more than 15,000 reads were included from the samples Fine Sand (A; n = 5), Coarse Sand (B; n = 7) and Clay (C, n = 5). Panel D shows expected richness in pooled samples compared to mean expected replicate richness. Error bars represent standard error, for pooled samples calculated as described in Heck et al [47].

