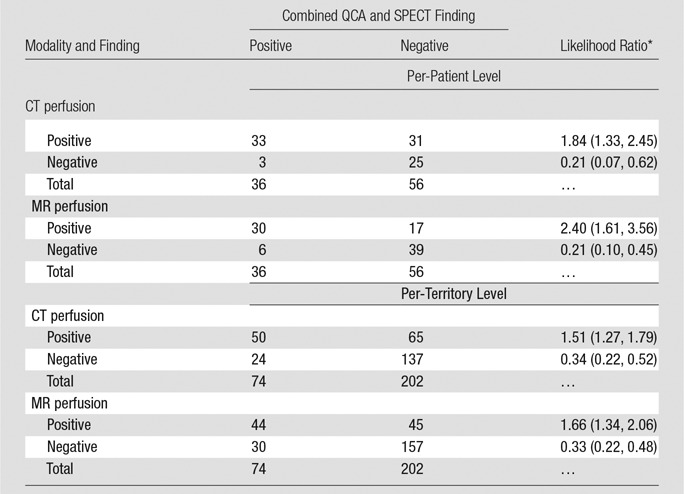
Table 2.
Direct Comparison of CT Perfusion and MR Perfusion Results at the Per-Patient and Per-Territory Levels in Comparison with Combined QCA and SPECT

Note.—Patients and territories deemed not interpretable would have been considered nondiagnostic for statistical analysis. However, in none of these cases was inadequate interpretability due to poor image quality.
