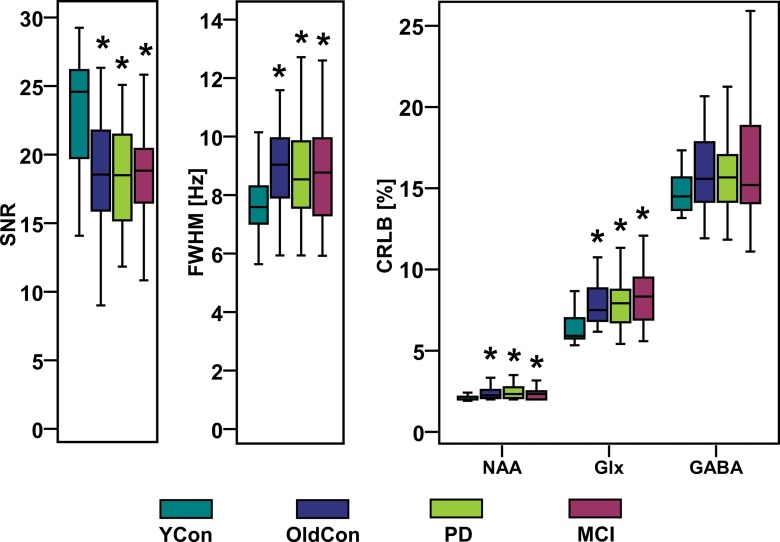
Figure 6:
Boxplots with SNR, linewidth (FWHM) of NAA, and CRLB-NAA, CRLB-Glx, and CRLB-GABA calculated with LCModel show high spectral quality of all groups. * = significant difference when compared with young control group (YCon) at a significance level of P ≤ .008 (Bonferroni-corrected Mann-Whitney posthoc test). OldCon = older control group.

