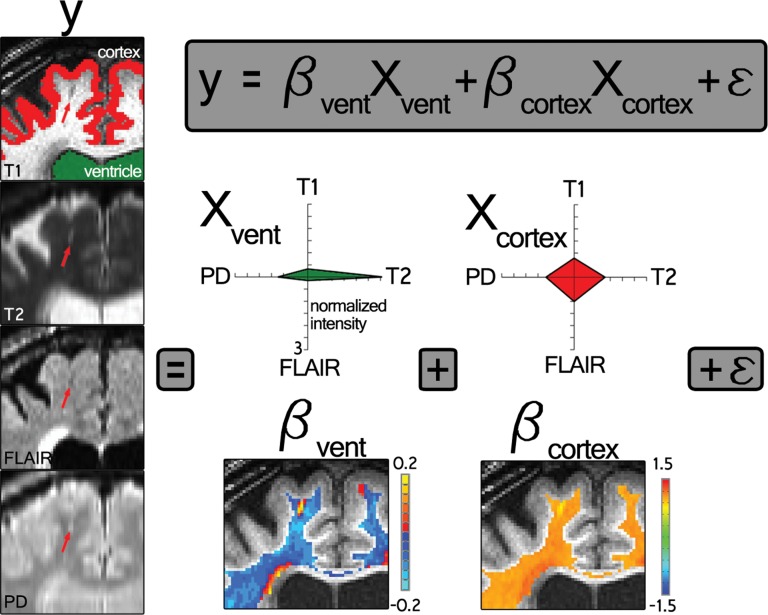
Figure 2a:
Intensity-based voxel-of-interest detection. (a) Voxelwise regression run within white matter voxels. Radar plots represent one participant’s CSF predictor (green, Xvent ) and gray matter predictor (red, Xcortex ). (b) An example of data (y, each radar plot depicts the fingerprint across all sequences for that color-coded voxel shown on the left middle) and derived regression coefficients for nine voxels centered on an identified PVS in a coronal section. Bvent and Bcortex are regression coefficients associated with Xvent and Xcortex , respectively. PD = proton density,

