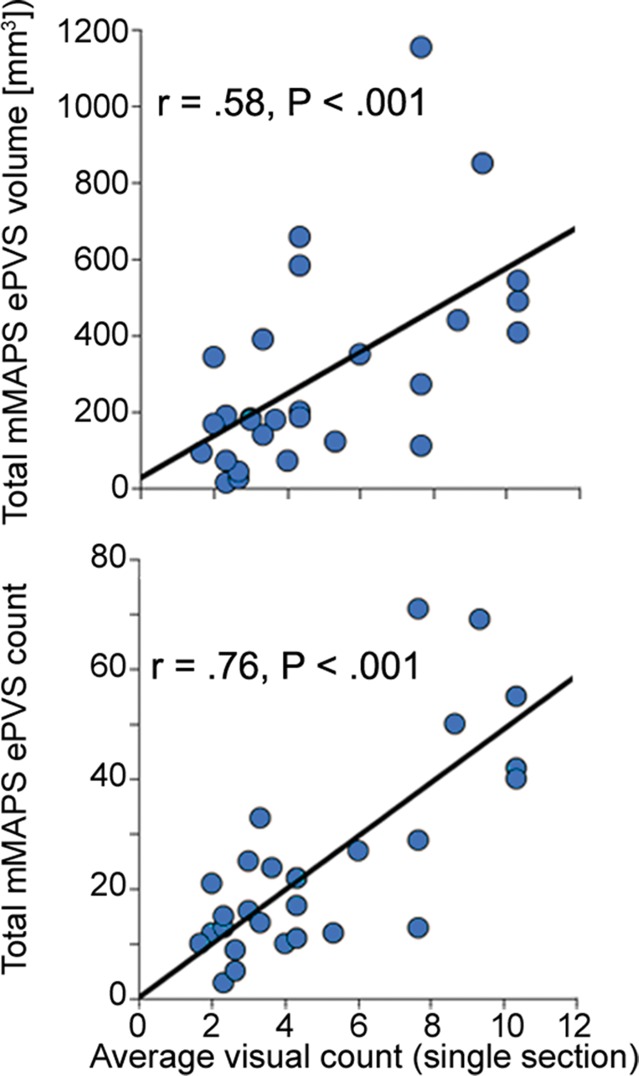
Figure 4c:
Signal-to-noise ratio (SNR) and CNR measurements, visual count ratings, and mMAPS results. (a) Native and normalized signal-to-noise ratio and CNR measurements for ePVS versus normal-appearing white matter. PD = proton density, WM = white matter. (b) Visual ratings correlated well with one another (top), as well as with the results of mMAPS (bottom) in single-section measurements. Blue line is that of the expert rater (c) Single-section visual counts are correlated with total PVS volume, as measured with mMAPS (top) and total mMAPS ePVS count (bottom). (d) Distributions of volume (left), linearity (middle), and width (right) over all mMAPS-identified ePVSs. (e) mMAPS measured were correlated between repeated measures of the same participants for total volume (top) and count (bottom). (f) Spatial likelihood of the occurrence of an identified ePVS in all participants overlaid on a representative T1-weighted volume.

