Figure 1.

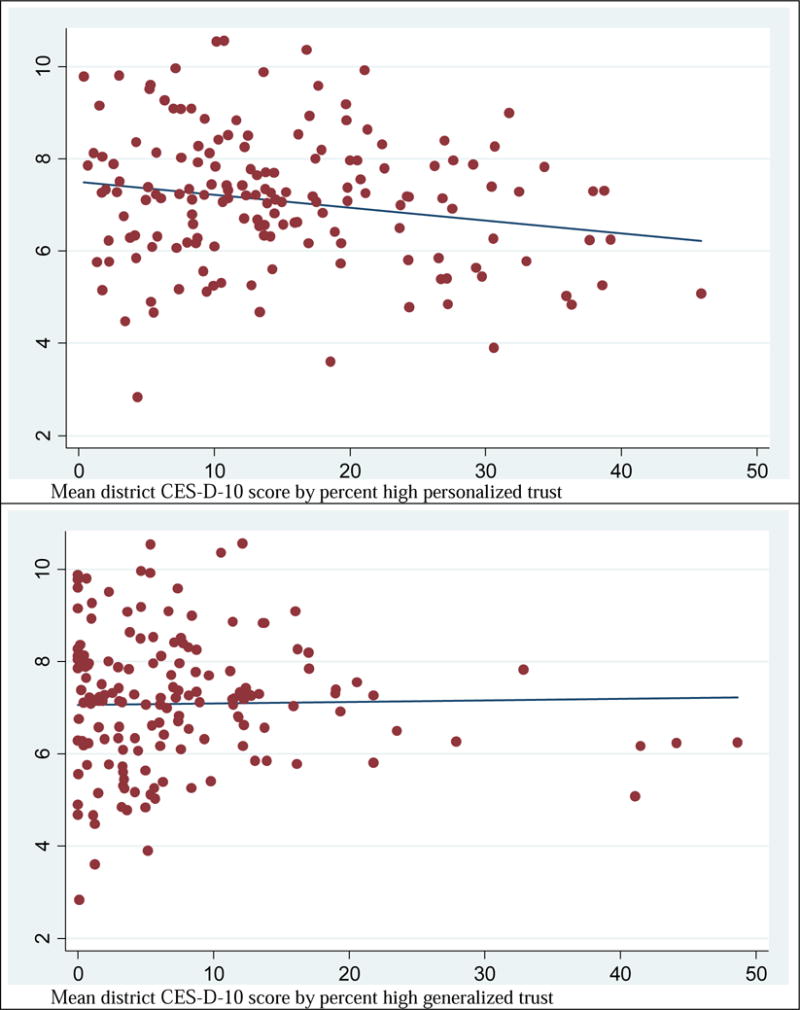
Scatter plots of mean district-level depressive symptoms (y-axis) by district-level high personalized trust (top panel) or high generalized trust (bottom panel) (x-axis), pooled Waves 1, 2, and 3.

Scatter plots of mean district-level depressive symptoms (y-axis) by district-level high personalized trust (top panel) or high generalized trust (bottom panel) (x-axis), pooled Waves 1, 2, and 3.