
Fig. 1.
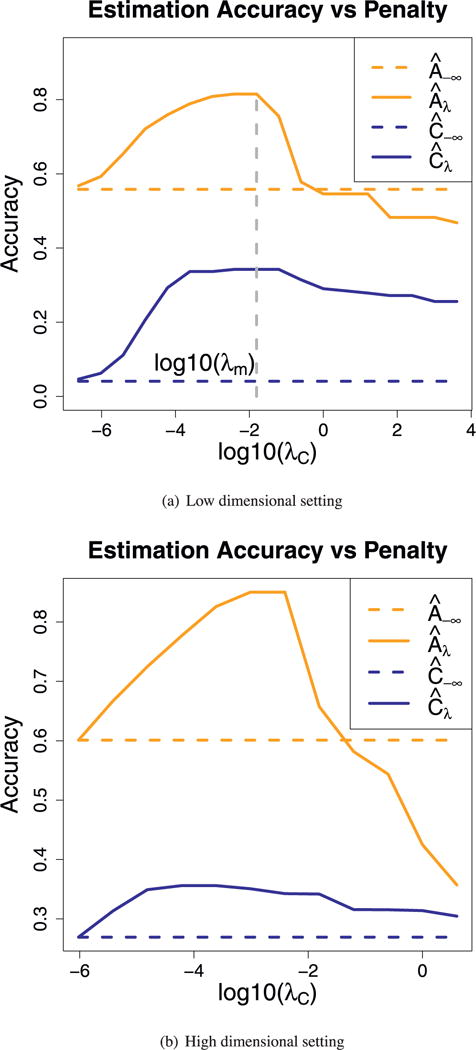
x axis is tuning parameter λC under log scale and y axis is the distance between truth and estimations; λA is increasing proportionally with λC. One can see that in both the low dimensional and hight dimensional setting, estimation accuracies for A and C first increase then decrease as penalty increases.