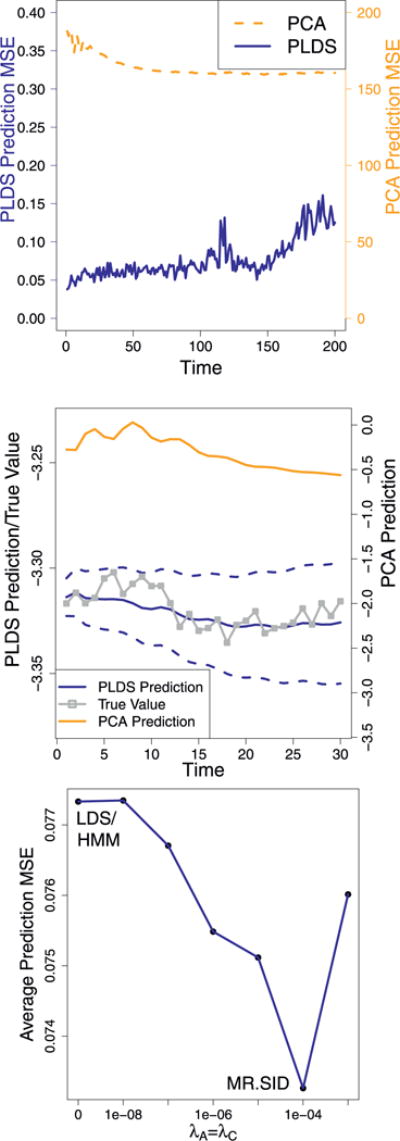
Fig. 4.

Predictions on HCP data: (1) MR. SID and SVD predictions over time, with accuracies measured as mean squared error (MSE). (2) Sample time series plot. True signals and predictions are both averaged over a sample of 20 voxels. The dotted blue lines represents the 60% prediction interval of MR. SID. Values were log-scaled for plotting. (3) Prediction accuracies of LDS/HMM and MR. SID.
