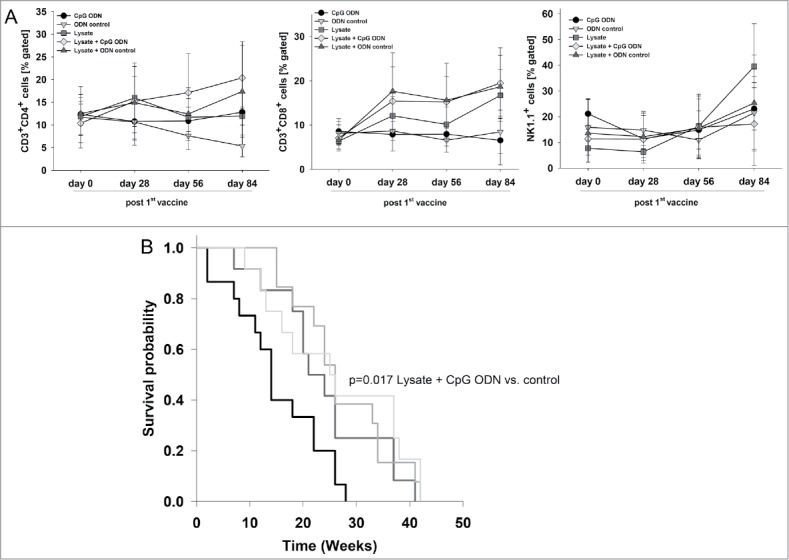
Figure 2.

Prophylactic vaccination of MLH1−/− mice with a cellular lysate. (A) Flow cytometric phenotyping of peripheral blood leukocytes. Blood samples were taken at start of treatment ( = day 0) and regularly during the experiment. Given are the percentage numbers of positively stained cells as determined by gating on viable cells from vaccinated (lysate (n = 12) +/− CpG ODN 1826 (n = 15) and ODN control (n = 12)) and control mice (CpG ODN 1826or control ODN 1826; n = 9 and n = 7 mice per group, respectively). Values are given as mean ± SD; *p < 0.05 vs. control; t-test. (B) Kaplan Meier survival curve of vaccinated and control MLH1−/− mice. Log rank survival analysis, p = 0.017 Lysate + CpG ODN vs. control.
