
Figure 4.
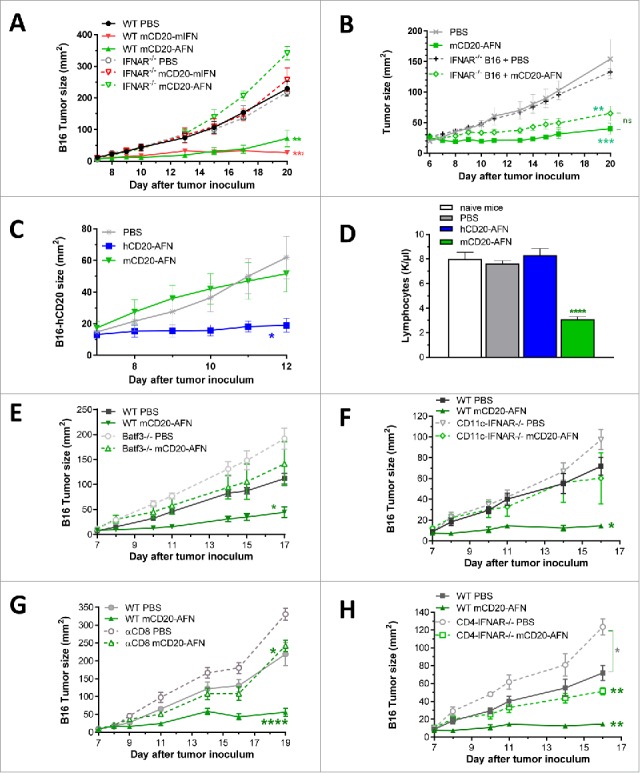
Antitumor efficacy of tumor-targeted AcTaferon depends on cDC1 and CTL. (A) Growth of B16-mCD20+ tumors in IFNAR1-deficient versus WT mice after 7 treatments with PBS or tumor-targeted mIFN or AFN (n = 5 mice per group). (B) Growth of B16-mCD20+ or B16-mCD20+-IFNAR−/− tumors in WT mice after 10 treatments with PBS or tumor-targeted AFN (n = 12 mice per group, pooled results of 2 different IFNAR−/− B16-mCD20+ clones). (C) Growth of s.c. inoculated B16-hCD20+ tumors in C57BL/6J mice after treatments with PBS, hCD20-AFN or mCD20-AFN. Shown is a representative experiment (n = 5 mice per group). (D) Lymphocyte counts in fresh EDTA-blood collected 1 day after the last treatment of mice represented in C. ‘Naive mice’ are tumor-free. (E) Growth of B16-mCD20+ tumors in Batf3−/− mice (lacking cDC1) and WT littermates after 6 treatments with PBS or mCD20-AFN (n = 7 mice per group). (F) Growth of B16-mCD20+ tumors in CD11c-IFNAR-deficient mice (lacking IFNAR in cDC1 and cDC2) and WT littermates after 5 treatments (n = 4 mice per group). (G) Growth of B16-mCD20+ tumors in CD8-depleted mice and controls after 6 treatments (n = 5 mice per group). (H) Growth of B16-mCD20+ tumors in CD4-IFNAR-deficient mice (lacking IFNAR in T lymphocytes) and WT littermates after 5 treatments (n = 4 mice per group). All results shown are a representative of two independent repeats. Shown are mean ± s.e.m. *P < 0.05, **P < 0.01, ***P < 0.001 and ****P < 0.0001 compared with PBS treated animals unless otherwise indicated; determined by two-way ANOVA with Dunnett's multiple comparison test.