
Figure 5.
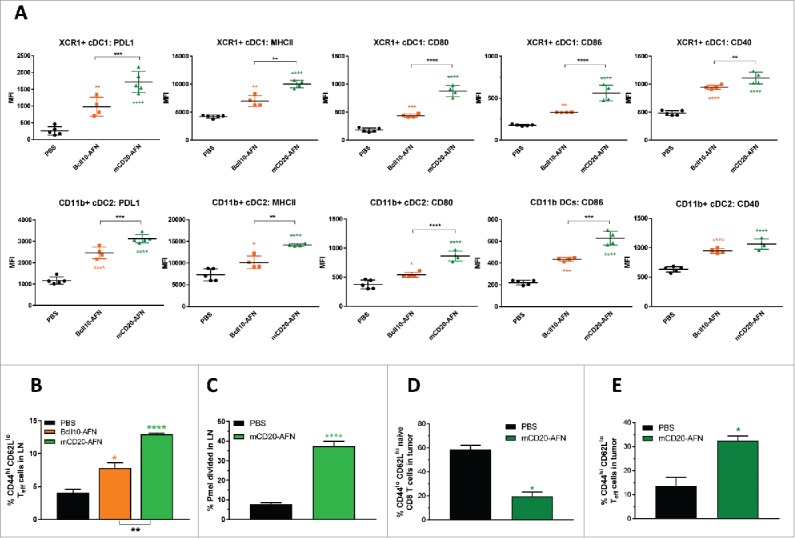
DC and CTL responses during AcTaferon treatments. (A) Flow cytometric profiling of the DC activation status in the tumor draining lymph node in response to AFN treatment. DCs were identified as CD3− CD19− Ly6C− CD11cint-hi MHCIIint-hi cells and subdivided into XCR1+ cDC1 and CD11b+ cDC2. Expression levels of PDL1, MHCII, CD80, CD86 and CD40 are displayed as MFI in the respective fluorescence channels. Results shown are a representative of two independent repeats (n = 5). (B) Flow cytometric analysis of CD3+ CD8+ T cell phenotype based on the expression of CD44 and CD62L was performed on tumor-draining lymph nodes of mice bearing B16 tumors, five days after perilesional delivery of the AFNs indicated in the figure legend (n = 3). Effector T cells were identified as CD44 high and CD62L low. (C) Flow cytometric analysis of Pmel-1 T cell proliferation in the tumor-draining lymph node in response to perilesional AFN treatment of B16-mCD20 tumor-bearing mice. Data show the percentage of T cells having undergone at least one division. (D-E) Flow cytometric analysis of CD3+ CD8+ T cell phenotype based on the expression of CD44 and CD62L was performed on B16 tumors, five days after perilesional delivery of the AFNs indicated in the figure legend (n = 3). Naive cells (D) were identified as CD44 low and CD62L high, effector T cells (E) as CD44 high and CD62L low. Shown are individual values (A) and mean ± s.e.m. of a representative experiment of at least 2 independent repeats (A-E); *P < 0.05, **P < 0.01, ***P < 0.001 and ****P < 0.0001 compared with PBS treated animals unless otherwise indicated; by one-way ANOVA with Tukey's multiple comparison test.