
Figure 6.
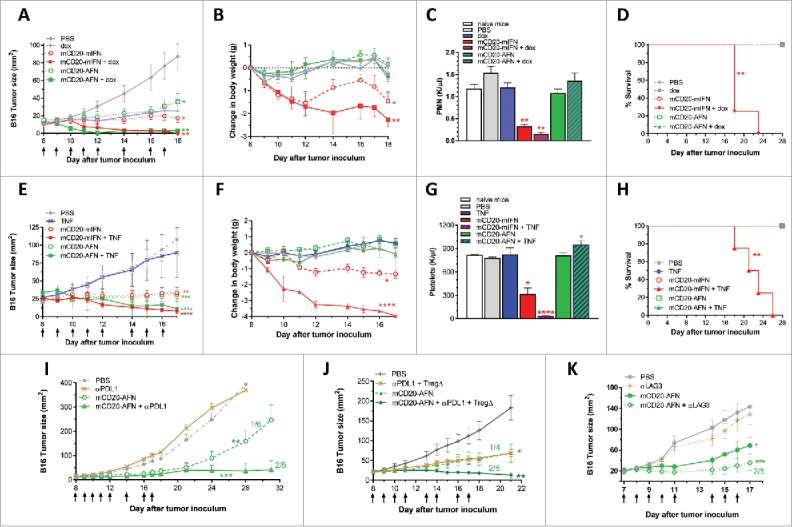
Tumor-targeted AcTaferon combination treatments eradicate tumors without toxicity. (A) Growth of s.c. inoculated B16-mCD20+ tumors in C57BL/6J mice, body weight loss (B), neutrophil counts (C) and mortality (D) after 8 treatments with PBS, tumor-targeted mCD20-mIFN or mCD20-AFN (n = 5 mice per group, shown is a representative experiment, arrows indicate treatment days). When indicated in the legends, tumors were also treated with dox(orubicine) every second day. (E) Growth of s.c. inoculated B16-mCD20+ tumors in C57BL/6J mice, body weight loss (F), platelet counts (G) and mortality (H) after 8 treatments with PBS, tumor-targeted mCD20-mIFN or mCD20-AFN (n = 5 mice per group, shown is a representative experiment, arrows indicate treatment days). When indicated in the legends, tumors were also treated with low-dose (0.6 μg/mouse) TNF every second day. (I-K) Growth of s.c. inoculated B16-mCD20+ tumors in C57BL/6J mice treated with PBS or mCD20-AFN. When indicated, treatment was combined with anti-PDL1 sdAb or a combination of Treg-depleting (TregΔ) anti-CTLA4 + anti-OX40 antibodies. Dividend/divisor in the figures indicates the number of tumor-free mice over the number of total mice at the day the experiment was ended, indicated in the X axis. For all figures, a representative experiment is shown (n = 4-6 per group), repeated at least twice. All values are mean ± s.e.m.; *P < 0.05, **P < 0.01, ***P < 0.001 and ****P < 0.0001 compared with PBS treated animals unless otherwise indicated; by two-way ANOVA with Dunnett's multiple comparison test (A-B, E-F, I-K), one-way ANOVA with Dunnett's multiple comparison test (C, G) or log-rank test (D, H).