Figure 2.
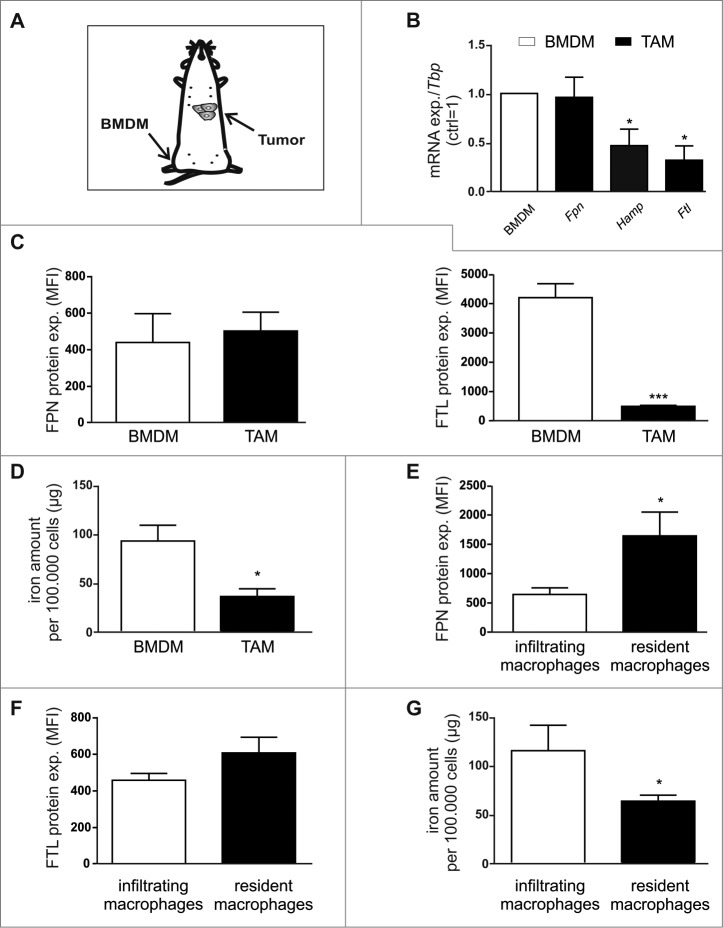
TAM adopt an iron-release phenotype in vivo. (A) Schematic overview of sample preparation. (B) mRNA expression of iron-regulated genes (Fpn, Hamp, Ftl) in F4/80+ TAM sorted from tumors of PyMT mice was analyzed by qPCR and normalized to Tbp expression. Changes were determined relative to the respective expression in BMDM from the same animal (n = 5–8). (C) Protein expression of FPN (surface, left panel) and FTL (intracellular, right panel) in TAM (solid bars) and BMDM (open bars) was determined by flow cytometry (MFI, mean fluorescence) (n = 4–8). (D) Iron amount in the lysates of TAM (solid bar) was quantified by AAS relative to the cell number (open bar) (n = 7–13). Protein expression of (E) FPN and (F) FTL in infiltrating MΦ (open bars) and resident MΦ (solid bars) was determined by flow cytometry (MFI, mean fluorescence) (n = 11–15). (G) Iron amount in the lysates of infiltrating MΦ (open bar) and resident MΦ (solid bar)was quantified by AAS relative to the cell number (n = 8–10). Data are means ± SEM from independent experiments, *p < 0.05, **p < 0.01, ***p < 0.001 vs. the respective controls unless indicated otherwise.

