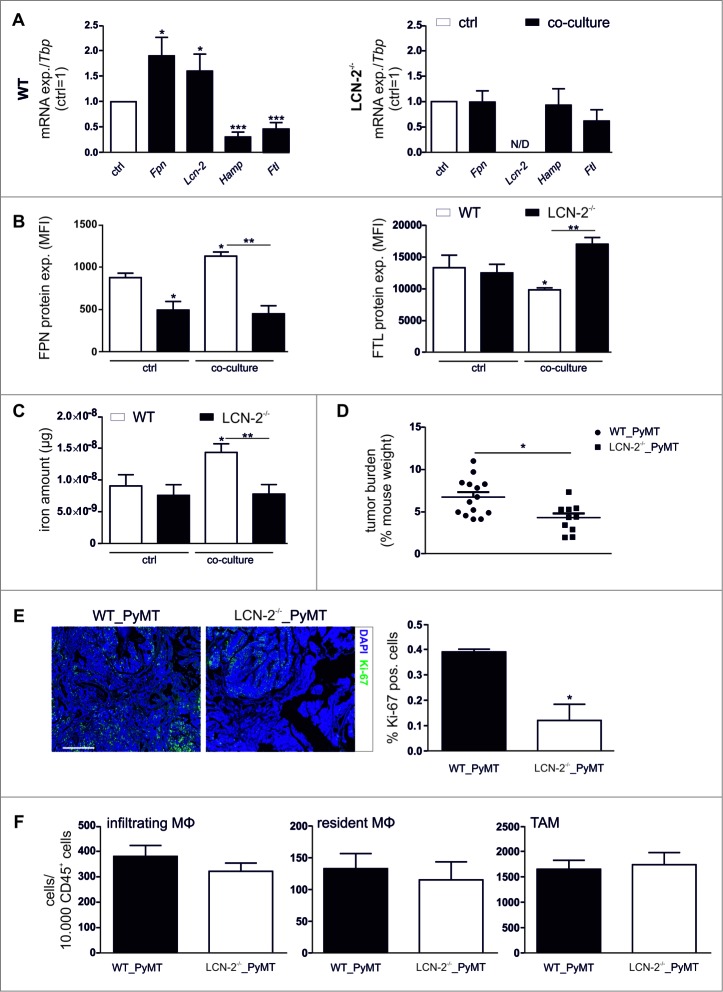
Figure 6.
LCN-2−/− attenuates the iron-release phenotype in TAM. (A) mRNA expression of iron-regulated genes (Fpn, Lcn-2, Hamp, Ftl) in wildtype (WT) (left panel) or Lcn-2−/− (right panel) BMDM after co-culture with E0771 cells (solid bars) was analyzed by qPCR and normalized to Tbp expression, relative to the respective expression in naïve control MΦ (ctrl, open bar) (n = 9–18). (B) Protein expression of FPN (surface, left panel) and FTL (intracellular, right panel) in Lcn-2−/− (solid bars) and WT BMDM (open bars) was determined by flow cytometry (MFI, mean fluorescence) (n = 3). (C) Iron amount in the supernatant of WT (open bars) or LCN-2−/− (solid bars) BMDM after co-culture was quantified by AAS and normalized to supernatants of naïve, sictrl transfected MΦ (n = 8–14). (D) Tumor burden at the day of death of wildtype (WT) (n = 14) or LCN-2−/− (n = 11) mice. P-value was calculated using two-tailed Student's t test. (E) Sections from wildtype (WT) and LCN-2−/− PyMT tumors were stained for Ki-67 with the Opal dye technique. DAPI was used as nuclear stain. Scale bar is 100 µm. Representative pictures are shown. Quantification was done using the Inform software (n = 3). (F) Infiltration of MΦ subpopulations (infiltrating and resident MΦ) as well as total amount of F4/80+ TAM into wildtype (WT) and LCN-2−/− PyMT tumors was detected via flow cytometry (n = 15). Data are means ± SEM from independent experiments, *p < 0.05, **p < 0.01, ***p < 0.001 vs. the respective controls unless indicated otherwise.

