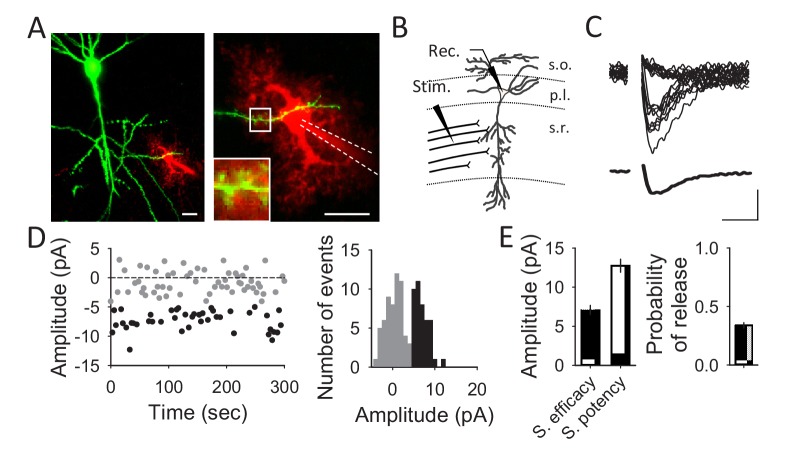
Figure 1. Unitary CA3-CA1 synapse recordings from hippocampal pyramidal neurons.
(A) Fluorescent images showing a pyramidal cell expressing GFP (green) and an astrocyte loaded with Texas Red (red) through the recording pipette. Scale bars: 20 µm. (B) Schematic drawing depicting a recorded CA1 pyramidal neuron and the stimulating electrode. (C) Representative EPSC traces obtained with the minimal stimulation technique showing successes and failures in neurotransmitter release (n = 20; upper panel) and the average trace acquired from those traces (synaptic efficacy; lower panel). Scale bars: 5 pA, 10 ms. (D) EPSC amplitudes of a representative synapse that showed failures (grey) and successes (black) in neurotransmitter release (left panel) and its corresponding histogram (right). (E) Synaptic parameters (synaptic efficacy, synaptic potency and probability of release) obtained from representative recordings (n = 40 synapses).

