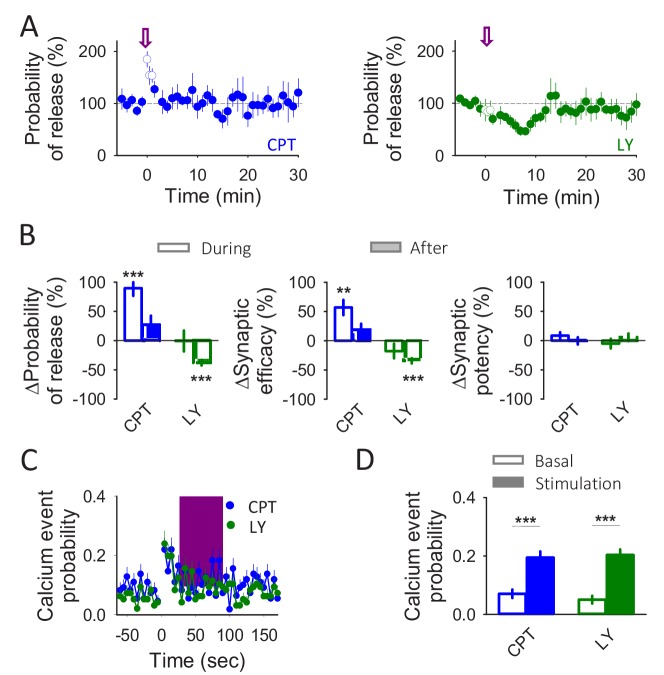
Figure 4. Astrocytes release glutamate and ATP/adenosine in response to neuronal activity.
(A) Synaptic parameters vs time in the presence of CPT (2 µM) or LY367385 (100 µM). Zero time correspond with the beginning of the IN depolarization train (arrow). The open circles show the synaptic parameters measured during the IN depolarization train. (B) Relative changes in synaptic parameters during and after the IN depolarization train in the presence of CPT (2 µM; n = 7) or LY367385 (100 µM; n = 4). (C) Calcium event probability vs time in the presence of CPT (2 µM) or LY367385 (100 µM). The pink area corresponds with the duration of the stimulus. (D) Changes in the calcium event probability 15 s before (basal) and 15 s after the stimulation started in the presence of CPT (2 µM; n = 109 astrocytes) or LY367385 (100 µM; n = 96 astrocytes). Data are represented as mean ± s.e.m., *p<0.05, **p<0.01, ***p<0.001.


