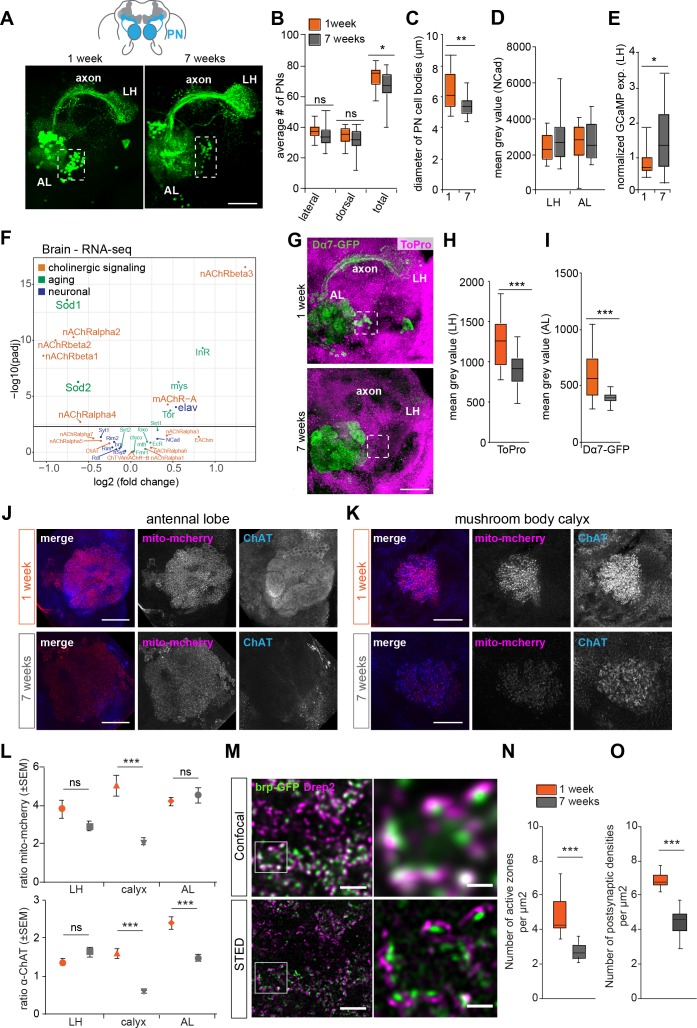
Figure 3. Changes in axon and synapse integrity could affect projection neuron function.
(A) Projection neurons (PNs) of a 1 and a 7 weeks old brains are labeled with a reporter line (GH146-Gal4;UASGCaMP3 or GH146 >GCaMP3) and stained with an anti-GFP antibody (green). AL, antennal lobe; cx, mushroom body calyx; LH, lateral horn; lateral cell body cluster is shown in dotted box. Scale bar: 25 µm. (B) Average number of PNs in the lateral, dorsal clusters and the total of both clusters. Orange boxes represent young flies (1 week), while grey boxes represent old flies (7 weeks) in all figures. There is a mild but significant decrease in the number of reporter-labeled PNs in aged flies (Students t-test, n = 19–21) (C) Average diameter of projection neuron cell body sizes of 1 (orange) and 7 (grey) weeks old flies. The cell bodies of PNs of aged flies are significantly smaller (Students t-test, n = 19–21). (D) The box plot shows that there is no change in the expression of NCad in the defined areas for quantification (antibody staining against N-cadherin as a synaptic marker) in 1 (orange) and 7 (grey) weeks old flies AL and LH (Students t-test, n = 19–21). (E) Normalized expression levels of the GCaMP reporter protein in PNs (GH146 >GCaMP3) in young and old flies. The expression was normalized to Ncad antibody staining. There is no reduction of GCaMP expression in old as compared to young flies, but instead a slight but significant increase (Students t-test, n = 19–21). (F) Volcano plot of RNA-sequencing data of selected genes displaying the genes that are downregulated and upregulated in 7 weeks old brains compared to 1 week old brains, respectively. Only genes above the cutoff of –log10 (p-value adjusted (padj)) are considered significantly changed (above black line). While several AChR receptors were significantly downregulated in the brain, this was not the case in the antenna (Figure 4—figure supplement 2C). In addition, several aging-related genes are upregulated in older brains. Selected genes are displayed and were color-labeled by gene ontology analysis (orange: aging; green: neuronal function). (G) Reporter construct showing the localization of acetylcholine receptor (AChR) Dα7 (GH146-Gal4;UAS-Dα7-GFP, stained with anti-GFP antibody (green)) and ToPro nuclear marker (shown in pink) in the AL and lateral horn (LH). There is a decline at PN postsynaptic sites in the AL supporting an aging-related decline in the integrity of cholinergic synapses. For instance, the localization of Dα7 at presynaptic terminals and axons is lost in old flies (n = 20/20) in contrast to young animals (n = 0/20). See missing signal in axon and presynaptic terminals in the MB calyx and LH. Scale bar: 25 µm (H) Quantification of mean gray value (MGV) of ToPro staining of cell bodies in the area of the LH revealed a decrease in the number of cells in old as compared to young flies (n = 20). (I) A box plot shows a significant reduction in the AChR Dα7 reporter construct signal (mean grey value, MGV) of 7 weeks old flies (grey) compared to 1 week old flies (orange) at the level of the AL. Box plots show median and upper/lower quartiles. All p-values represent: ns > 0.05, *p≤0.05, **p≤0.01, ***p≤0.001. (J) Representative images of antennal lobes of 1 and 7 weeks old flies. Brains express the reporter mito-mcherry in PNs (GH146-Gal4;UAS-mito-mcherry; anti-RFP, red) and are stained for anti-ChAT (blue). (K) Representative images of the mushroom body calyx of 1 and 7 weeks old flies. (L) Quantification of relative expression of a mitochondria reporter (GH146-Gal4;UAS-mito-mcherry) and ChAT in AL, LH, and calyx. Note that mitochondria and ChAT staining are significantly reduced in the MB calyx as compared to an mito-mcherry or ChAT expression in other parts of the brain in old flies as compared to younger animals (see methods). This suggests that ChAT does not decrease equally in all brain parts, but in particular in areas such as the MB calyx. Graphs display mean relative levels ± SEM. Student’s t-test: ns > 0.05, *p≤0.05, **p≤0.01, ***p≤0.001. (M) Confocal and high-resolution STED microscopy images in the calyx of flies expressing BRP-shortGFP under control of GH146-Gal4 driver line. Green and magenta represent anti-GFP and anti-Drep2C-Term immunostaining, respectively. White squares in (M, left column) indicate the magnified region in (M, right column). Scale bars represent 2 μm in (M, left) and 0.5 μm in (M, right). (N) Number of active zones and (O) postsynaptic densities significantly decrease upon aging. n = 10–12; Student’s t-test. ***p<0.001. Box plots indicate means, medians, interquartile ranges, and 1–99% ranges.

