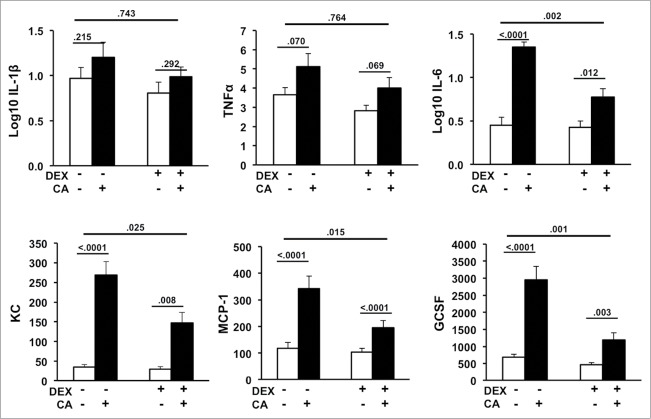
Figure 2.
Serum levels of IL-1β, TNF-α, IL-6, GCSF, KC, and MCP-1 in mice 24-hours after CA or NS injection in the presence or absence of DEX (12 mice per group). Each bar represents the mean ± SEM of each value. P-values derived from one-way or two-way ANOVA are indicated in each figure. The threshold for detection was 3.2 pg/mL. P-values derived from one-way or two-way ANOVA are indicated in each figure.

