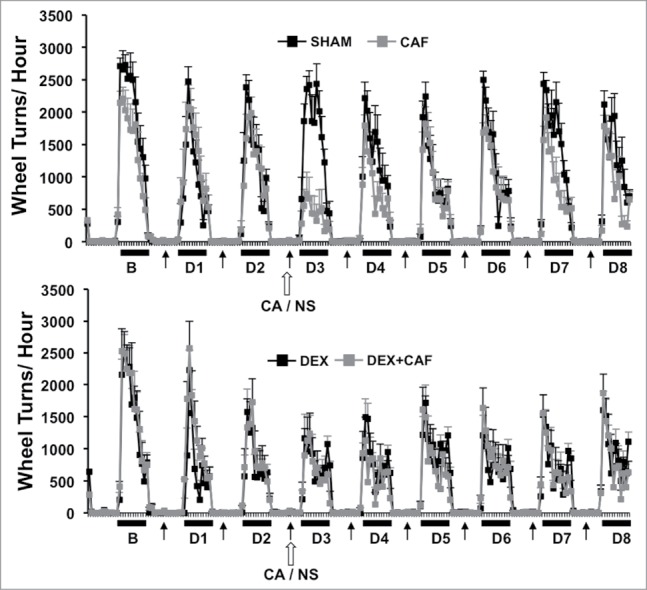
Figure 3.

Number of wheel turns per hour in the dark and light phase one day prior to (B) and throughout the first 8-d treatment cycle (D1 to D8) in sham and CA treated mice (Top Panel) and Dex and DEX + CA treated mice (Bottom panel). Solid arrows indicate the timing of s.q. normal saline or dexamethasone injection. Open arrows indicate the timing of CA or NS i.p. injection. Each data point represents the mean ± SEM of each value.
