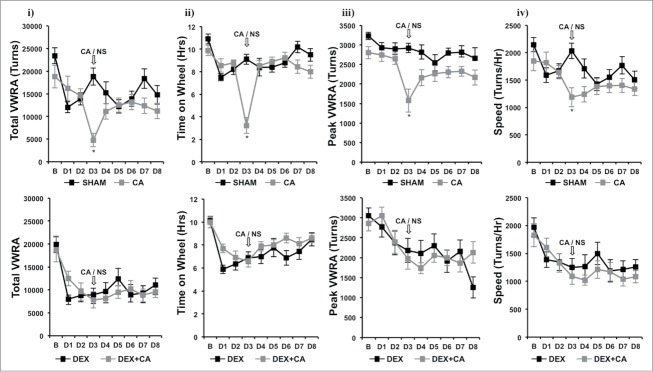
Figure 4.
i) total VWRA, ii) time on wheel, iii) peak VWRA, and iv) average speed (see methods section for further description of these variables) in Sham and CA-treated mice (Top Panel) and DEX and DEX+CA treated mice (Bottom Panel). Each data point represents the mean ± SEM of each value. Open arrows indicate the timing of CA or NS i.p. injection. Group differences on each day of treatment were examined by one-way ANOVA with Bonferroni correction for multiple comparisons. Follow-up post hoc tests (LSD) were performed to determine which groups differed (See results for details). Significant differences between Sham and CA-treated mice (Top panel) or DEX and DEX+CA treated mice are indicated by a *.

