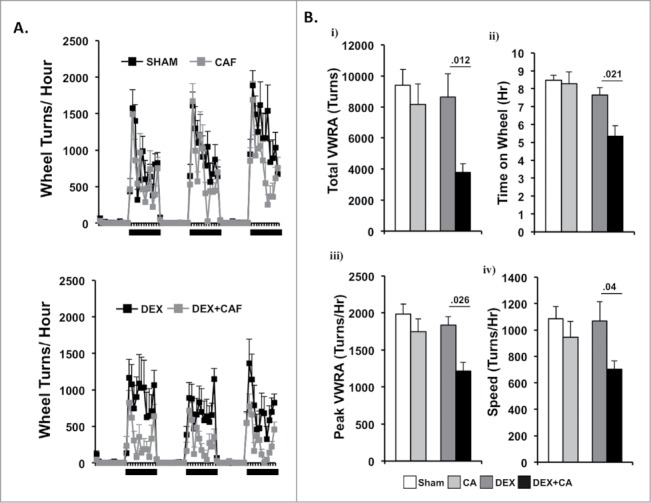
Figure 5.

(A) Number of wheel turns per hour in the dark and light phase during a 3-d period two- weeks after the 4th treatment cycle in sham and CA treated mice (Top Panel) and DEX and DEX + CA treated mice (Bottom panel). Each data point represents the mean ± SEM. (B) i) total VWRA, ii) time on wheel, iii) peak VWRA, and iv) speed averaged across the 3-d. Each bar represents the mean ± SEM of each value. Group differences were examined by one-way ANOVA. Significant group differences are indicated by p-values.
