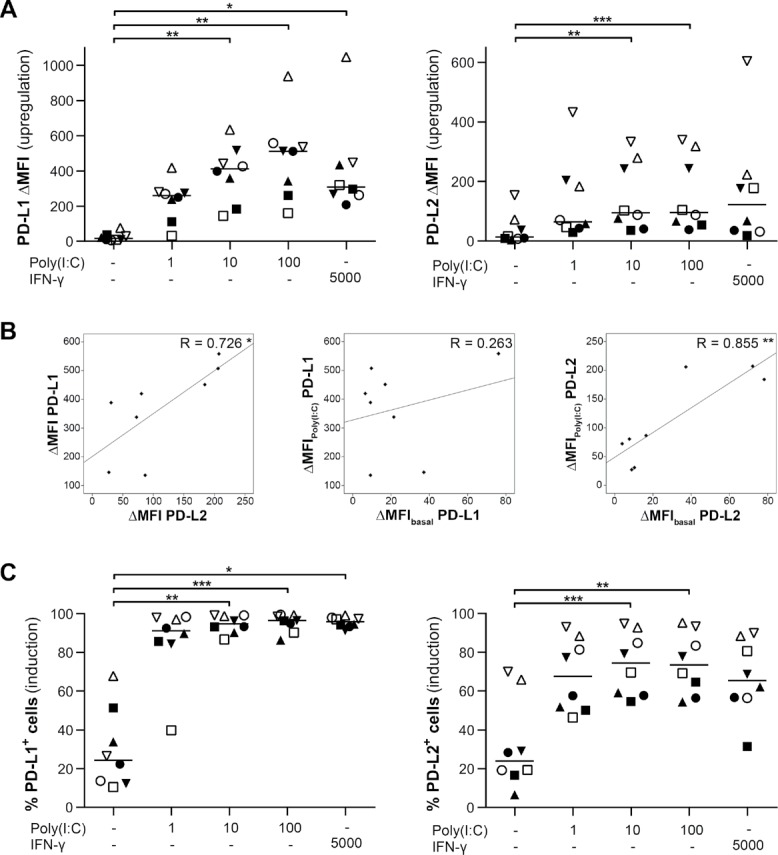
Figure 1.

Poly(I:C) stimulates PD-L1 and PD-L2 expression on primary human glioblastoma cells. (A and C) Poly(I:C) upregulates (A; ΔMFI) and induces (C; % positive cells) expression of both PD-L1 and PD-L2 on primary glioblastoma cells; n = 8; Friedman test with Bonferroni correction; concentrations are denoted in µg/ml poly(I:C) and U/ml IFN-γ. (B) Plots showing correlations between PD-L1 and PD-L2 upregulation as well as between the expression levels at basal or poly(I:C) treatment conditions for each protein. Treatment with 10µg/ml poly(I:C) was selected for analysis; Pearson's correlation coefficient. Bar represents median. Symbols depict primary glioblastoma cells derived from different glioblastoma patients. *, p < 0.05; **, p < 0.01; ***, p < 0.001.
