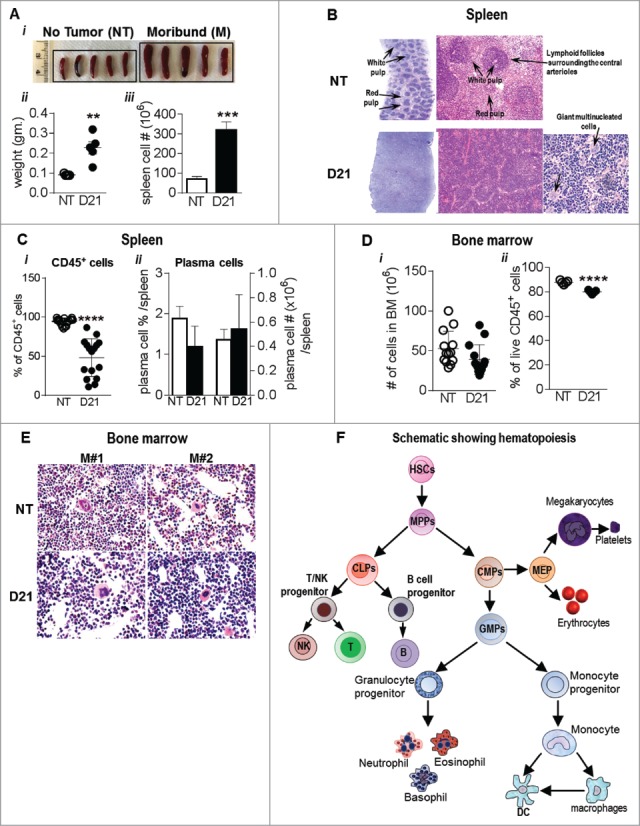
Figure 3.

Spleens from melanoma bearing mice show features of extramedullary hematopoiesis: (Ai) Image showing splenomegaly in B16-F10 melanoma bearing mice compared to NT mice. (ii) Spleen weights and (iii) total cell # post RBC lysis are also indicated. (B) Representative images showing HE stains of paraffin embedded spleen sections from NT and melanoma mice. (C) Percentage of (i) CD45+ hematopoietic cells and (ii) plasma cells (CD138+, CD19+) in NT and B16-F10 melanoma spleens were analyzed by flow cytometry. (Di) Total number of bone marrow cells from NT and B16-F10 melanoma mice (2 femur and 2 tibia) and (ii) % of CD45+ hematopoietic cells in the bone marrow post RBC lysis as analyzed by flow cytometry. (E) Representative images showing HE stains of paraffin embedded bone sections from WT and melanoma bearing mice. (F) Schematic showing hematopoiesis and generation of mature cells. Data was analyzed by Student's t-test. Mean ± SD are shown. **p < 0.01, ***p < 0.005, ****p < 0.001.
