
Figure 1.
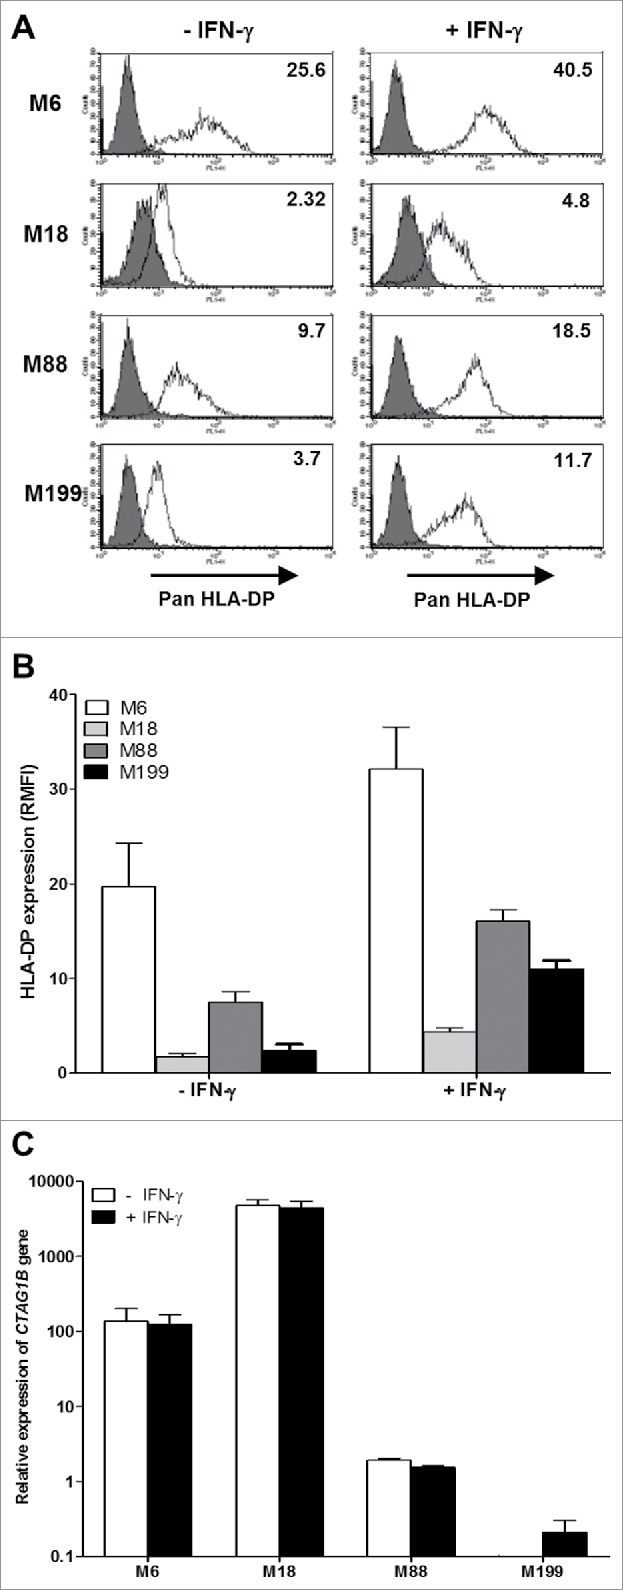
HLA-DP and NY-ESO-1 expression by melanoma cell lines. (A) The melanoma cell lines were cultured for 24 h in the absence or presence of 500IU/mL IFN-γ and then labeled with an IgG1 isotype control antibody (grey) or a monoclonal antibody directed against HLA-DP (white) followed by a staining with a fluorescent secondary antibody. Fluorescence was analyzed by flow cytometry. RMFI is shown on histograms. (B) Results are expressed as the mean ± SEM of RMFI of three independent HLA-DP staining experiments. (C) The melanoma cell lines were cultured for 24 h in the absence or presence of 500IU/ml of IFN-γ. Relative expression of the CTAG1B gene that encodes NY-ESO-1 was measured by RT-qPCR and determined with RPLPO gene expression used as reference. Indicated values are means ± SEM of relative expression of three independent experiments.