Figure 3.
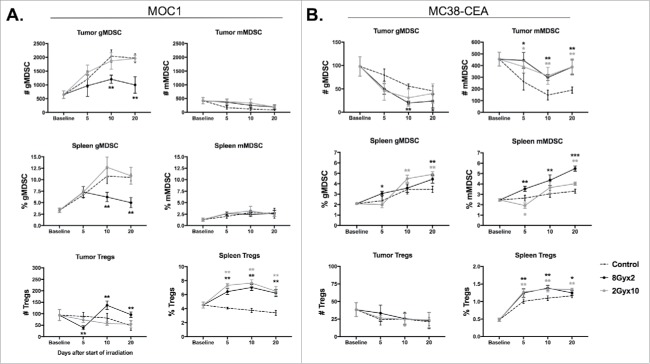
8Gyx2 and 2Gyx10 IR variably alters tumor and peripheral accumulation of immunosuppressive cell subsets. Primary tumor and splenic tissues (n = 5/time point) were harvested and analyzed as in Fig. 2. A, Immunosuppressive immune cell accumulation in MOC1 primary tumors and spleen. B, Immunosuppressive immune cell accumulation in MC38-CEA primary tumors and spleen. Quantification of tumor accumulation of cells presented as absolute number of cells per 1 × 10⁴ live cells analyzed. Quantification of splenic accumulation of cells presented as percentage of live, CD45.2+ cells analyzed. Cell subset definitions included gMDSC (CD11b+F4/80−Ly6GhiLy6Cint), mMDSC (CD11b+ F4/80−Ly6GlowLy6Chi) and Tregs (CD3+CD4+FoxP3+CD25hi). *, p < 0.05; **, p < 0.01; ***, p < 0.001 (t test) compared to control tumors for each time point.

