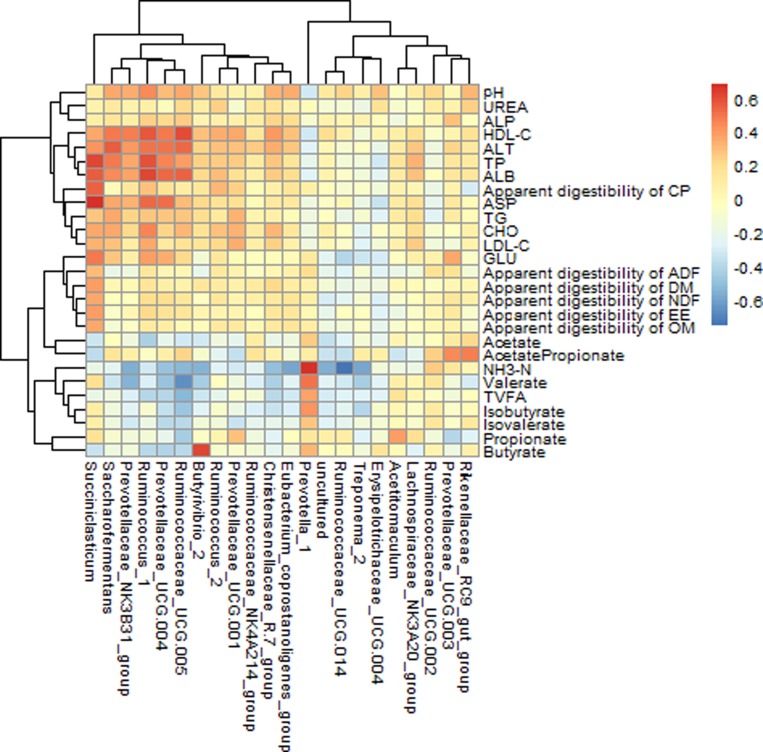
Figure 4. Correlation between bacterial genus abundance and rumen fermentation characteristics, nutrients apparent digestibility, serum biochemical parameters.
N = 32 for each point. Only the predominant bacterial genera (relative abundance ≥0.1% in each sample) are presented; Cells are colored based on spearman rank correlation test between rumen bacteria and rumen fermentation characteristics, nutrients apparent digestibility, serum biochemical parameters. The red color represents a positive correlation, the blue color represents a negative correlation.

