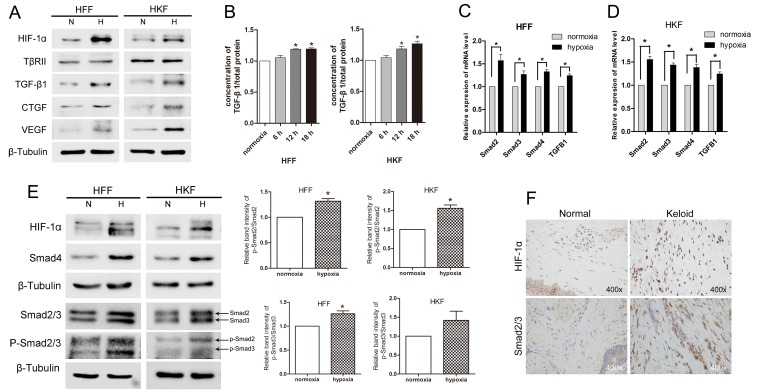
Figure 1. Hypoxia promoted TGF-β/Smad signaling in HFFs and HKFs.
(A) HIF-1α, TGF-β1, VEGF and CTGF protein levels were up-regulated by 24 h of hypoxia (1% O2) exposure, but TβRII expression did not obviously differ between the normoxia and hypoxia groups. (B) ELISA was used to detect secreted TGF-β1 in serum-free medium after 6 h, 12 h and 18 h of exposure to normoxia (21% O2) or hypoxia (1% O2). (C, D) Quantitative reverse transcriptase-PCR (qRT-PCR) analyses of Smad2, Smad3, Smad4 and TGF-β1 mRNA levels in HFFs and HKFs after 24 h of hypoxia or normoxia exposure. Bars show the means±SE of three independent experiments (n = 3); *represents P < 0.05. (E) Western blotting shows the protein levels of HIF-1α, Smad2/3, p-Smad2/3 and Smad4 after 24 h of hypoxia or normoxia exposure. The histogram shows the protein band intensity ratio of p-Smad2 to Smad2 and p-Smad3 to Smad3. (F) The expression of HIF-1α and Smad2/3 was tested using immunohistochemistry analysis.

