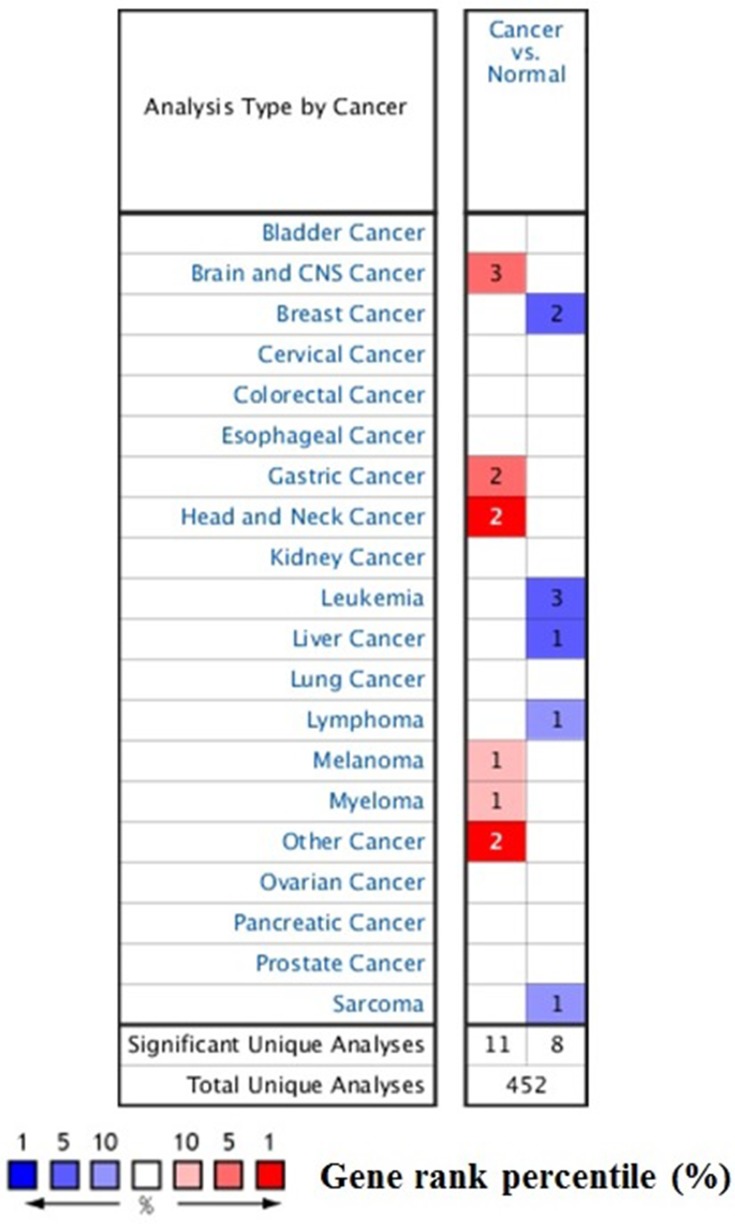
Figure 1. The transcription levels of STAT3 in different types of cancers.
This graphic was generated from Oncomine, indicating the numbers of datasets with statistically significant (p < 0.01) mRNA over-expression (Red) or down-expression (Blue) of STAT3 (different types of cancer vs. corresponding normal tissue). The threshold was designed with following parameters: p-value of 1E-4, fold change of 2, and gene ranking of 10%.

