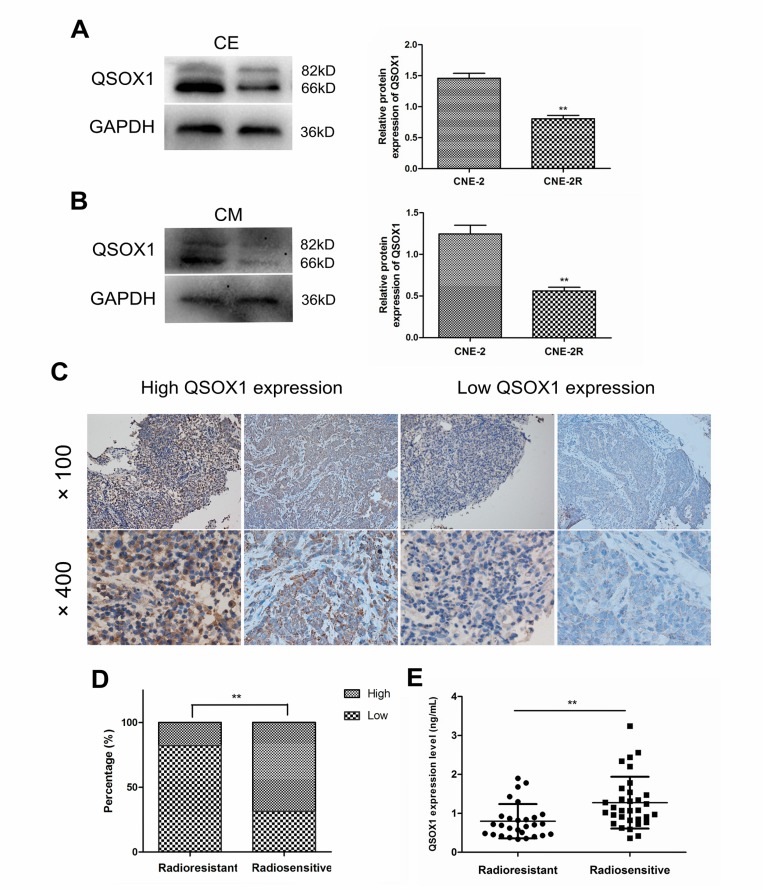
Figure 1. Expression of QSOX1 in NPC cell lines, serum and tumor tissues.
(A and B) Western blotting analysis of QSOX1 expression in cell extracts (CE) and conditioned media (CM) of CNE-2 and CNE-2R cell lines, and quantification of QSOX1 protein expression in cells. (C) Representative IHC images of QSOX1staining in tissue microarrays constructed from NPC patients with different radiosensitivities (original magnifications, 100× and 400×). (D) Expression rates of QSOX1 in the tissues of radioresistant and radiosensitive groups. (E) Serum concentration of QSOX1 in the two groups. *p < 0.05 and **p < 0.01.

