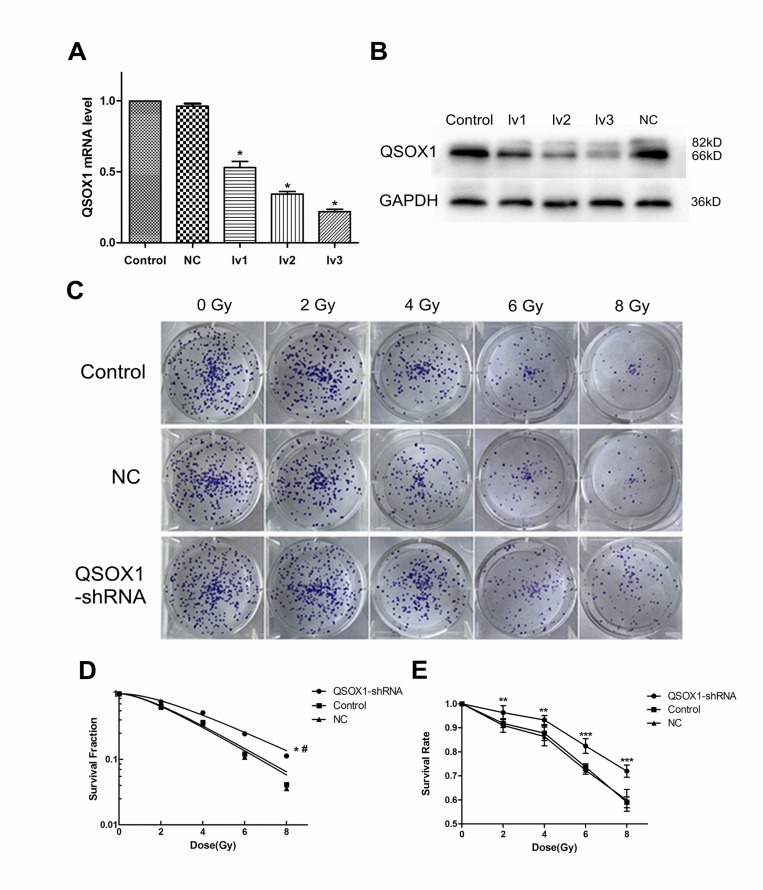
Figure 2. Knockdown of QSOX1 and its effect on radiosensitivity of NPC cells.
(A) RT-PCR analysis was performed to detect the expression of QSOX1 mRNA in different groups. (B) Western blot analysis demonstrating down-regulation of QSOX1 protein following shRNA transfection. (C) Representative colony formation images of control, NC and QSOX1-shRNA groups. (D) Dose-response curves were fitted according to the multi-target, single-hit model and analyzed using GraphPad Prism 5.0 software. *p < 0.05 vs. control; #p < 0.05 vs. NC. (E) Knockdown of QSOX1 increased the survival rate of CNE-2 cells after IR, with significant differences for all doses of radiation. *p < 0.05, **p < 0.01 and ***p < 0.001.

