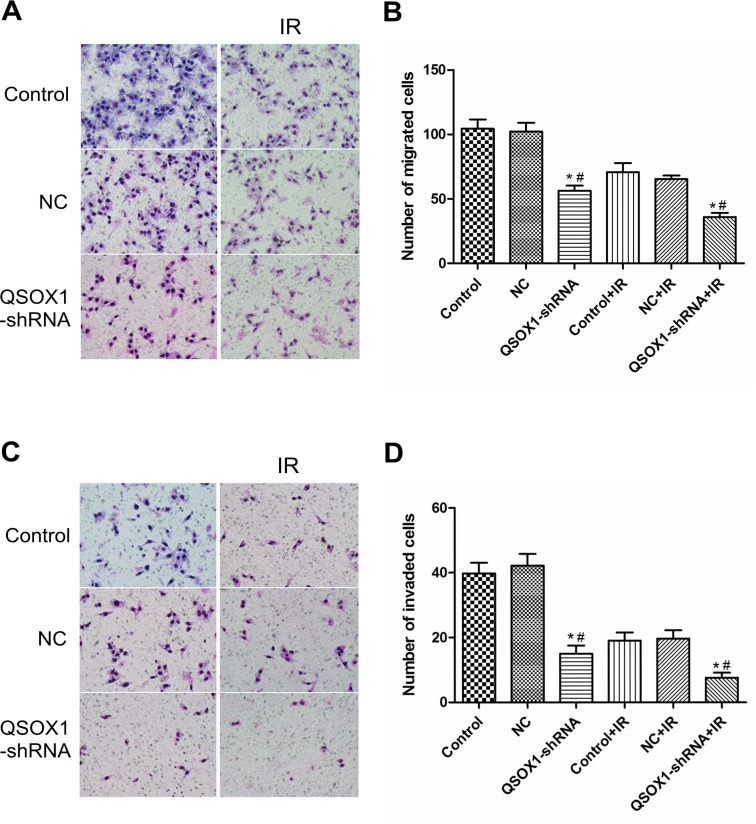
Figure 3. Effect of QSOX1 on cell migration and invasion.
(A and C) Representative micrographs depicting cell migration and invasion in the control, NC and QSOX1-shRNA groups (magnification, 200×). (B) Quantification of cells that had migrated through the transwell chambers. (D) Quantification of cells that had invaded through the transwell chambers precoated with Matrigel. *p < 0.01 vs. Control; #p < 0.01 vs. NC.

