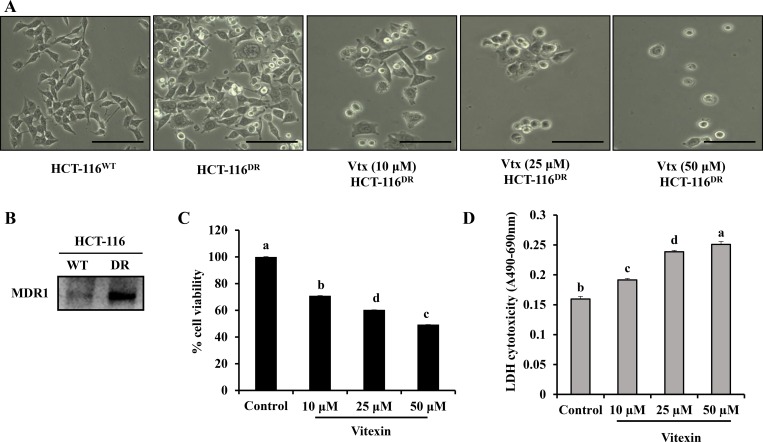
Figure 1. Growth inhibition of HCT-116DR cells by vitexin treatment.
(A) Cell morphological changes after treatment with 10 μM, 25 μM and 50 μM vitexin for 24 h. (B) Expression of MDR1 in HCT-116 and HCT-116DR cells. (C, D) Cells were treated with the indicated concentrations of vitexin for 24 h, and cell viability were determined by (C) MTT and (D) LDH assays as described in the Materials and Methods. Data represent the mean ± SD of three independent experiments (n = 3). Values with different letters (a–d) denote significant difference from one another (p < 0.05).

