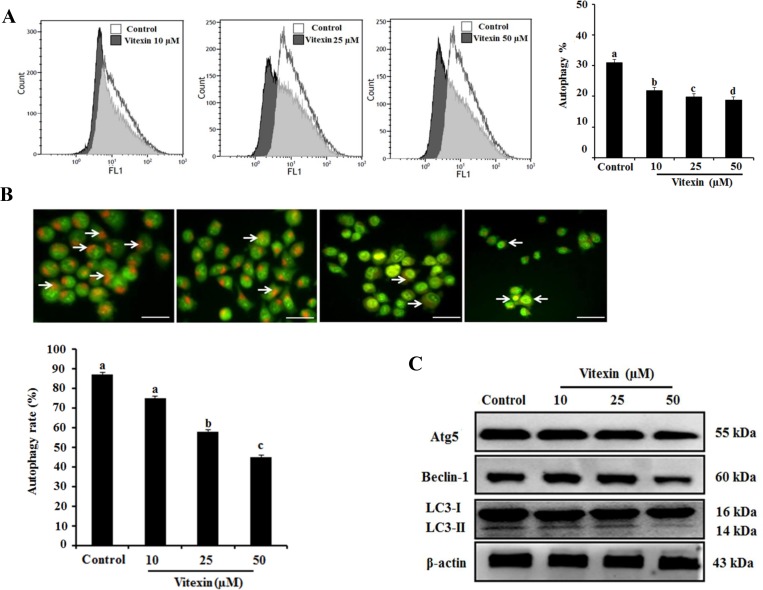
Figure 4. Effects of vitexin treatment on autophagy inhibition in HCT-116DR cells.
(A) Flow cytometric analysis was performed to measure cell autophagy using the Cyto-ID green autophagy reagent. Representative graph of autophagy percentage was determined by flow cytometry following treatment with vitexin for 24 h. (B) HCT-116DR cells were subjected to AO staining to allow determination of autophagosome formation (bright orange granules) using a fluorescence microscope (scale bar = 0.1 mm). The percentage of autophagic cells was calculated by observing 400 cells. (C) The protein levels of various autophagy markers were analyzed by western blot. Data represent the mean ± SD of three independent experiments (n = 3). Values with different letters (a–d) denote significant differences from one another (p < 0.05).

