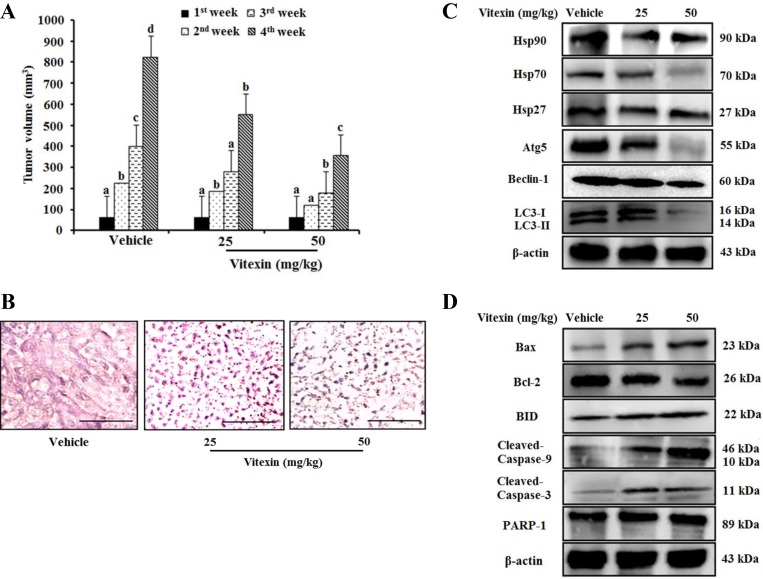
Figure 6. Vitexin treatment suppresses tumor growth in an HCT-116DR tumor xenograft model.
1 × 10⁷ HCT-116DR cells were inoculated subcutaneously into the right flank region, and mice were monitored for tumor development. When tumors attained a size of 5 × 5 mm3, mice were received vehicle or 25 mg/kg or 50 mg/kg vitexin by oral administration for 3 days per week. (A) Tumor volume of mice were observed after initiation of treatment. (B) Representative images of tumor sections after H&E staining. HSPs and autophagy-related protein level (C), and apoptosis marker proteins (D) were analyzed by western blot. Data represent the mean ± SD of three independent experiments (n = 3). Values with different letters (a–d) denote significant differences from one another (p < 0.05).

