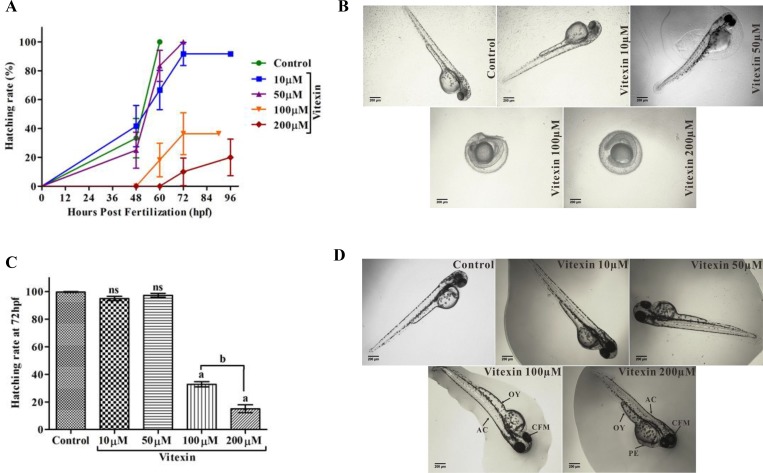
Figure 8. Influence of vitexin on zebrafish hatching and morphological changes.
(A) Overall hatching success of zebrafish after exposed with a dose-dependent concentration of vitexin (10, 50, 100 and 200 µM). (B) Delayed hatching morphology of zebrafish embryos at 72 hpf. (C) The graph represents the percentage of delayed hatching mechanism of zebrafish embryos induced by vitexin at (72 hpf). Data that are indicated by superscript letters are significantly different from the control embryos (One-way ANOVA by Tukey’s test, Comparisons: aP < 0.0001 vs control embryos, nsnon-significant with control, bP < 0.0001 vs 100 µM of vitexin. (D) Represents phenotypic changes of all experimental groups at 96 hpf. Arrow indicates severe malformations induced by vitexin at 100 and 200 µM concentrations, such as opaque yolk (OY), craniofacial malformation (CFM), and axial curvature (AC) when compared to control and other exposed doses of vitexin (Magnification ×4, Scale bar 200 µm).

