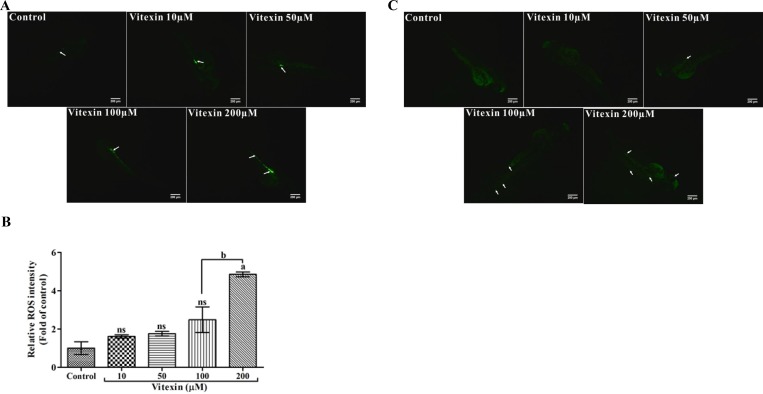
Figure 9. Effect of vitexin on the production of intracellular ROS levels in zebrafish larvae.
(A) The fluorescent probe DCFH-DA displays induced fluorescence intensities by vitexin at 200 µM in the intestinal region (white arrows and scale bar 200 µm). (B) Relative ROS intensities of all experimental larvae, the values are statistically significant (Tukey’s test), comparisons: aP < 0.05, nsnon-significant with control larvae and bP < 0.0001 vs 100 µM of vitexin. (C) Photomicrograph represents the acridine orange (AO) stained zebrafish larvae after treatment with vitexin in a dose-dependent manner (10, 50, 100 and 200 µM), Green fluorescent intensities evincing increased fluorescence of apoptotic bodies particularly in heart, tail and to some extent in eye regions (white arrows, scale bar 200 µm and magnification 4x).

