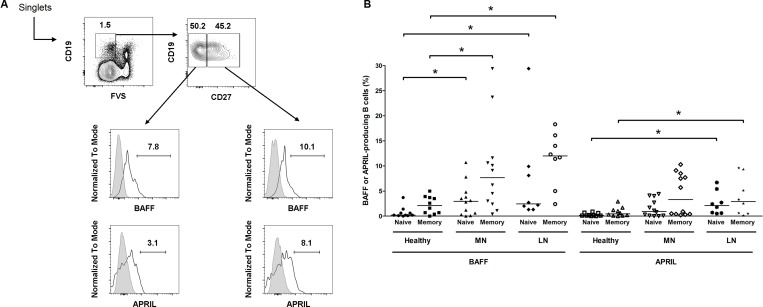
Figure 4. Flow cytometric analysis of BAFF or APRIL-producing B cells among total B cells.
(A) Representative gating strategy for B cells (upper) and histograms of BAFF+ and APRIL+ B cells (lower). (B) Pooled data of healthy controls and patients with MN or lupus nephritis. Lines represent the median levels. FVS, fixable viability stain; LN, lupus nephritis. *P < 0.05.

