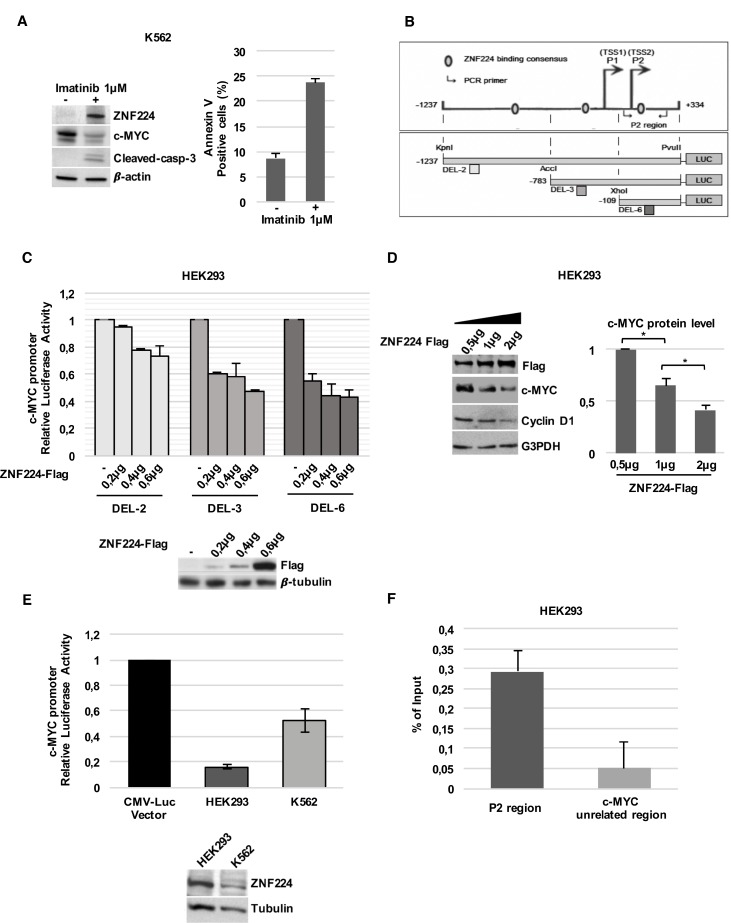
Figure 1. ZNF224 reduces c-Myc expression via a transcriptional mechanism.
(A) Western blot analysis of ZNF224, c-Myc and cleaved caspase-3 protein levels in K562 cells treated with Imatinib or vehicle only (DMSO), as control (−), for 48 hours . β-actin was used as loading control. One representative blot out of two performed is shown (left panel). Cell death was evaluated by annexinV-PE staining followed by flow cytometry. Results represent the means +/− SD of two independent experiments (right panel). (B) Schematic representation of c-Myc promoter region and DEL-2, DEL-3 and DEL-6 deletion constructs. (C) DEL-2, DEL-3 and DEL-6 constructs were transfected into HEK293 cells together with increasing amounts of 3X-Flag ZNF224 or 3X-Flag empty vector as control (−). After 24 h, the promoter activity was determined by normalizing Firefly to Renilla luciferase activity. Error bars represent standard deviations of two independent experiments. Expression of ZNF224-Flag was verified by western blot analysis. β-tubulin was used as loading control. One representative blot out of three performed is presented. (D) Western blot analysis of ZNF224-Flag, c-Myc and cyclin D1 protein levels in HEK293 cells transfected with increasing amounts of 3X-Flag ZNF224. G3PDH was used as loading control (left panel). Densitometric analysis of c-Myc protein levels. Error bars represent standard deviations of three independent experiments; *p < 0.05 (right panel). (E) DEL-6 construct was transfected into HEK293 cells and K562 cell. After 24 h, promoter activity was determined by normalizing Firefly to Renilla luciferase activity. DEL-6 activity was compared to CMV Luciferase activity obtained in each cell line. Error bars represent standard deviations of two independent experiments. ZNF224 expression was measured by western blot analysis. β-tubulin was used as loading control. One representative blot out of two performed is shown. (F) ChIP assay performed with an anti-ZNF224 antibody. Quantitative RT-qPCR analysis was performed using primers flanking the P2 region. A region downstream c-Myc locus was used as negative control (c-Myc unrelated region). Error bars indicate the mean value +/− SD of two independent experiments.

