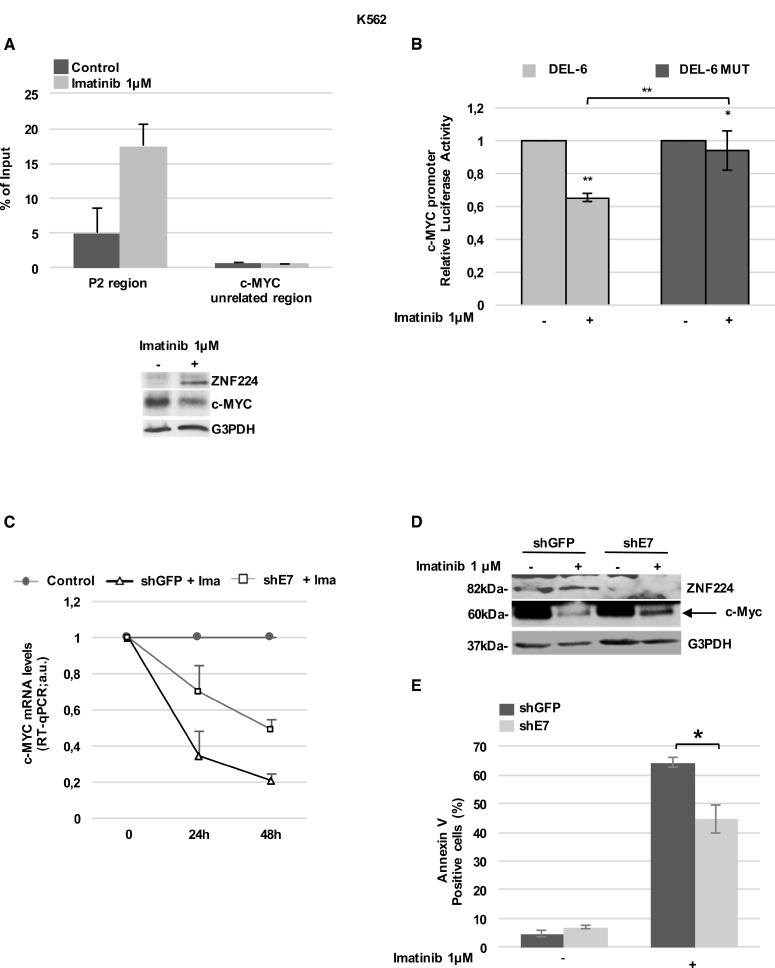
Figure 4. ZNF224 mediates the Imatinib-dependent transcriptional repression on c-Myc.
(A) ChIP assay performed with an anti-ZNF224 antibody in K562 cells treated with Imatinib or vehicle only (DMSO) as control for 24 h. Quantitative RT-qPCR analysis was performed using primers covering the P2 region. A c-Myc unrelated region was used as negative control. Error bars indicate the mean value +/− SD of two independent experiments (upper panel). ZNF224 and c-Myc protein levels were analyzed by western blot. G3PDH was used as loading control. One representative blot out of two performed is shown (lower panel). (B) K562 cells were transfected with DEL-6 or DEL-6-MUT constructs and after 24 hours treated with Imatinib. Luciferase activity was determined 24 hours later and promoter activity was normalized to Renilla luciferase activity. Error bars represent standard deviations of two independent experiments. *p < 0.05; **p < 0.005. (C) shE7 and shGFP cells were exposed to Imatinib or vehicle only (DMSO) for 48 hours. c-Myc mRNA levels were measured by RT-qPCR. Relative amounts of c-Myc mRNA levels in shE7 and shGFP cells treated with Imatinib were compared to those in shE7 and shGFP cells treated with DMSO (control). Error bars represent standard deviations of two independent experiments. (D) ZNF224 and c-Myc protein levels were measured by western blot analysis. Arrow indicates specific band. G3PDH was used as loading control. One representative blot out of two is presented. (E) Cell death was determined by annexin V staining followed by flow cytometry. Error bars represent standard deviations of three independent experiments. *p < 0.05.

