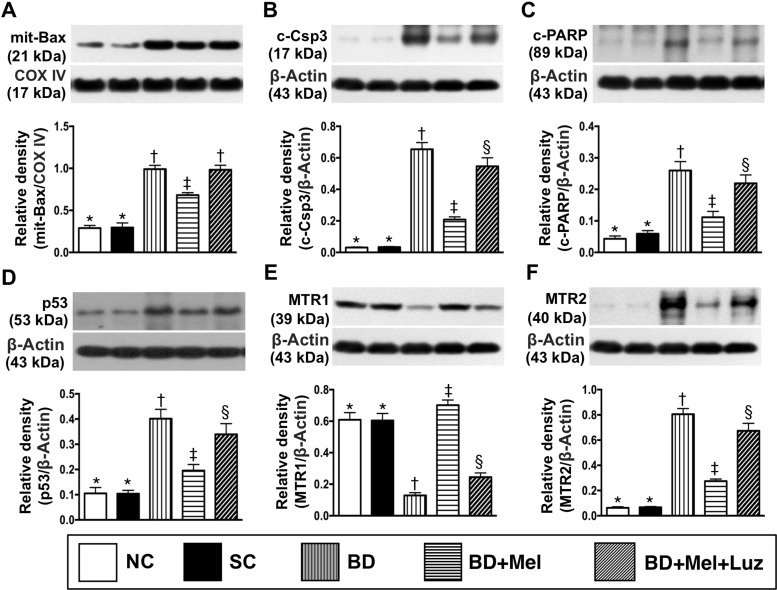
Figure 12. Protein expressions of apoptosis, P53 and MTR1/MTR2 in LV myocardium by day 5 after BD-derived tissue implantation.
(A) Protein expression of mitochondrial (mit)-Bax, * vs. other groups with different symbols (†, ‡), p < 0.0001. (B) Protein expression of cleaved caspase 3 (c-Casp 3), * vs. other groups with different symbols (†, ‡, §), p < 0.0001. (C) Protein expression of cleaved poly (ADP-ribose) polymerase (c-PARP), * vs. other groups with different symbols (†, ‡, §), p < 0.0001. (D) The protein expression of p53, * vs. other groups with different symbols (†, ‡, §), p < 0.0001. (E) Protein expression of melatonin receptor (MTR)1, * vs. other groups with different symbols (†, ‡, §), p < 0.0001. (F) Protein expression of MTR2, * vs. other groups with different symbols (†, ‡, §), p < 0.0001. All statistical analyses were performed by one-way ANOVA, followed by Bonferroni multiple comparison post hoc test (n = 6). Symbols (*, †, ‡, §) indicate significance (at 0.05 level). NC normal control; SC = sham control; BDEX = brain death extract; Mel = melatonin; Luz = luzindole.

