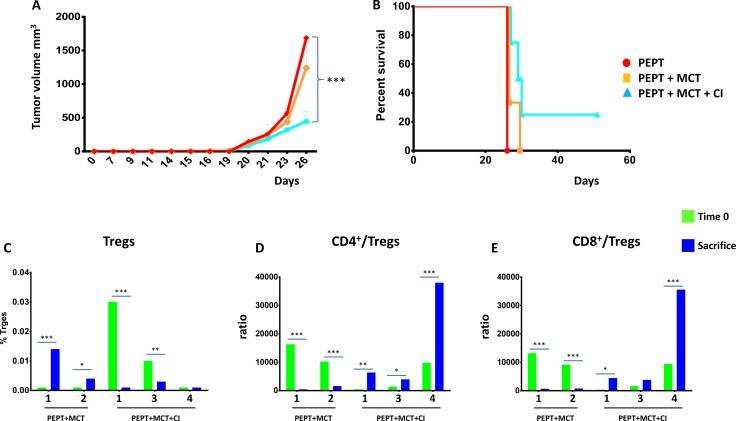
Figure 6. TN mice were re-challenged with 1 × 10⁵ cells in the left flank.
(A) As for the first immunization protocol, animals were monitored every 2 days for tumor growth and sacrifice occurred when tumor volume reached 1500 mm3. When the tumor reached the cutoff in the first animal (day 26), tumor volume in all the different groups was compared. (B) Kaplan-Meyer curve showing the percentage of survival of animals in the experimental groups. Days are from the re-challenge. Evaluation of CD4+ CD25+FoxP3 T regulatory cells (C) and TCD4+/Treg and TCD8+/Treg ratio (D and E) in the blood of each re-challenged animal at day 0 (green) and at sacrifice (blue).

