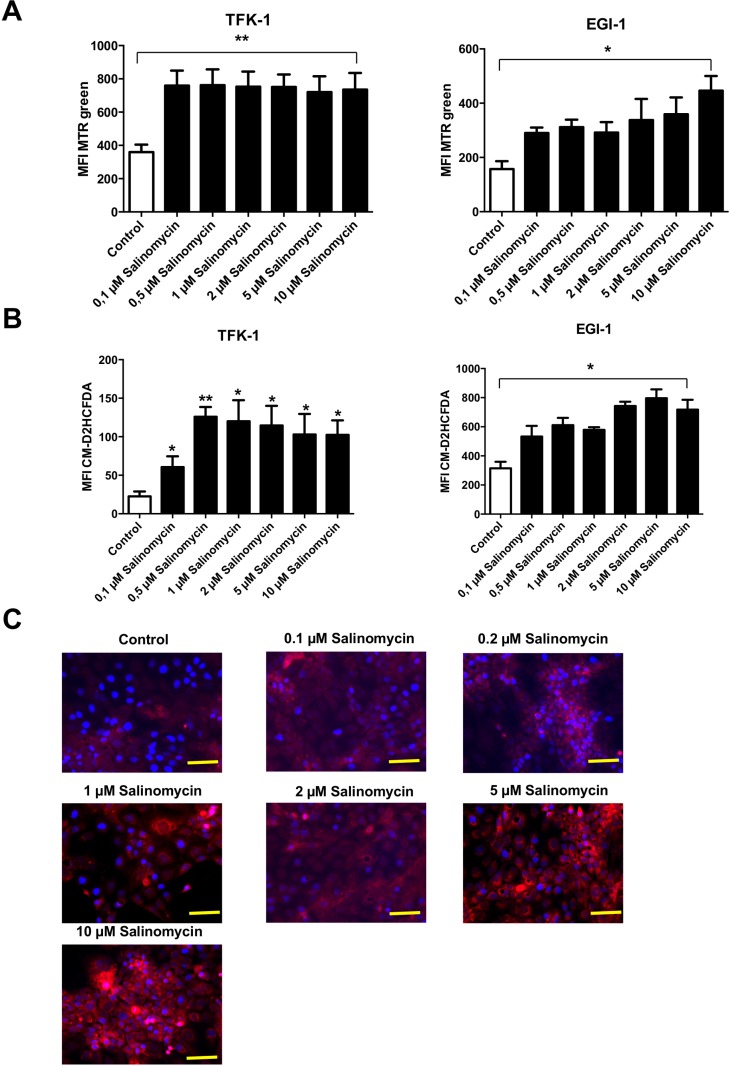
Figure 5. Treatment with Salinomycin results in accumulation of mitochondrial mass and increased generation of ROS.
(A) Analysis of total mitochondrial mass in TFK-1 and EGI-1 cells after exposure to increasing concentrations of Salinomycin (0.1, 0.5, 2, 5, and 10 μM) was assessed using MTR green. After 24 h, accumulation of mitochondrial mass was observed in both TFK-1 and EGI-1 cells. (B) Increased generation of ROS after treatment with Salinomycin in TFK-1 and EGI-1 cells using CM-H2DCFDA staining and analyzed by flow cytometry. (C) Immunostaining of TFK-1 cells after exposure of Sal confirmed increased ROS generation. Results are displayed as a summary of at least three independent experiments as mean ± SD or as representative image capture by fluorescence microscopy; *P < 0.05 compared with control. Scale bars = 50 µm.

