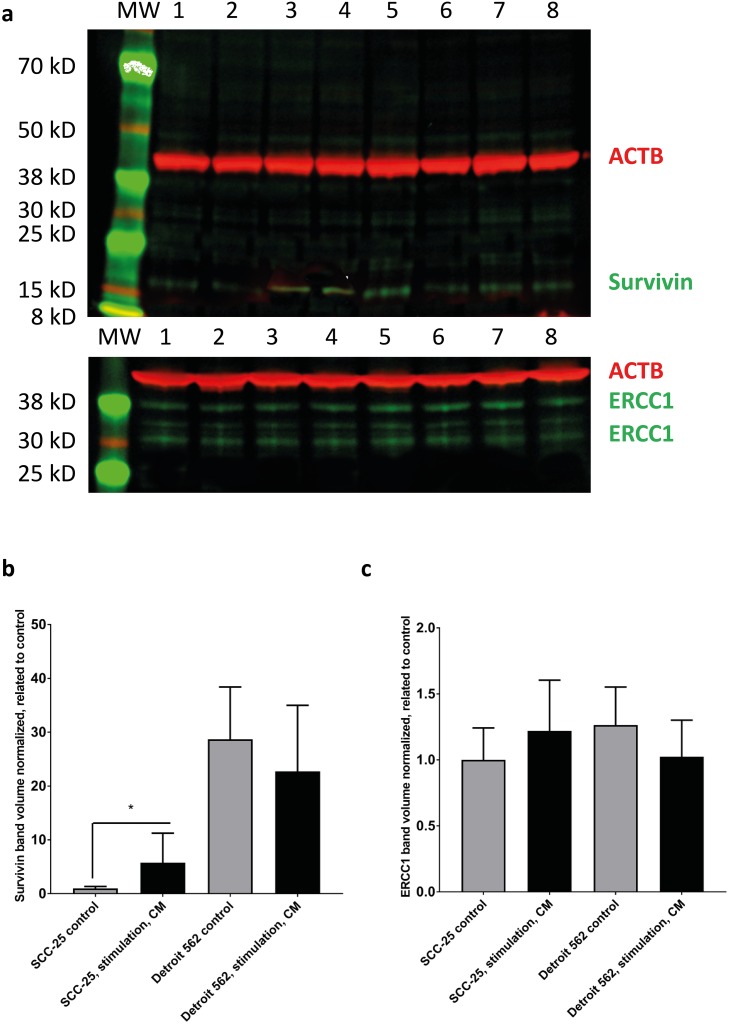
Figure 3. Western blot analysis of survivin and ERCC1 in SCC-25 and Detroit 562 cells in control and CM - treated conditions.
SCC-25 and Detroit 562 cells were treated with albumin - containing (control) or with CM medium (stimulation, CM) and subjected to western blot analysis of β-actin (red), survivin (green) or ERCC1 (green) in a two channel near infrared fluorescence detection system. β-actin loading control (42 kD), a single band was detected at 700 nm and is presented in red, survivin or ERCC1 were detected at 800 nm and are presented in green. (a) Survivin was detected as a single band in both SCC-25 (lanes 1-4) and Detroit 562 cells (lanes 5-8). ERCC1 was detected as multiple bands with two more intensive ones at 38 and 30 kD in both cell lines. More bands might be present in certain cell lines, which was also described by the data sheet of the antibody provider. Lanes 1-2: SCC-25 control, lanes 3-4: SCC-25 stimulation with CM, lanes 5-6: Detroit 562 control, lanes 7-8: Detroit 562 stimulation with CM; MW: molecular weight standard. (b-c) Column diagrams representing mean and standard error of measurement of normalized (to loading control, β-actin) survivin (b) and ERCC1 (c) band volumes from 8 gel lanes for each SCC-25 and Detroit 562 control and CM stimulated protein samples. The mean band volume of SCC-25 control was set as “1”. *: p < 0.05.

