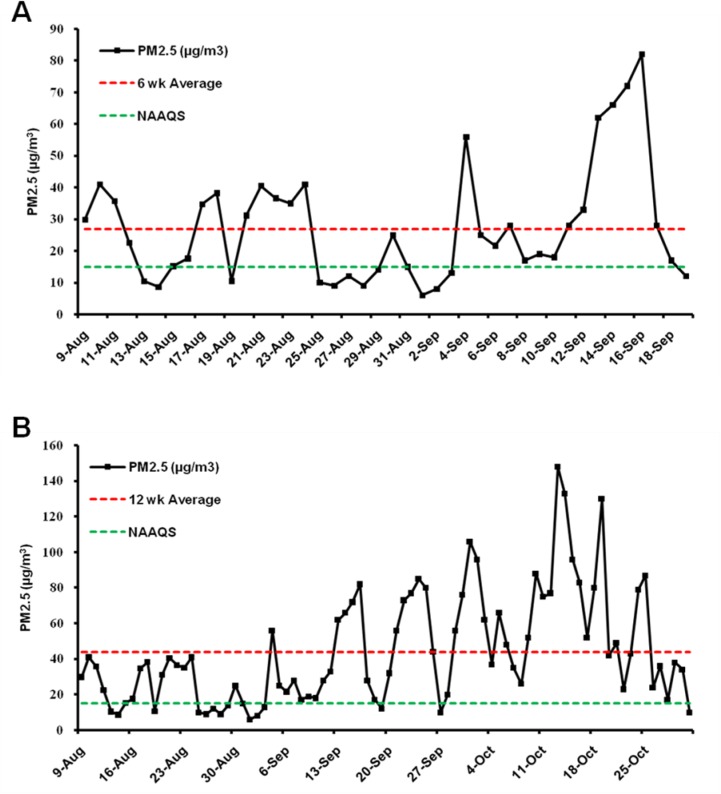
Figure 1. PM2.5 concentration during the exposure periods.
The mean daily PM2.5 concentration during the 6 week (A) and 12 week (B) exposure is displayed. The red dotted line indicates the average PM2.5 concentration during the exposure period and the green dotted line indicates the annual average PM2.5 National Ambient Air Quality Standard (NAAQS) of 15 µg/m3 in China. The mean daily PM2.5 concentration during the 6 week and 12 week exposure was 27 µg/m3 and 44 µg/m3, respectively (as the red dotted line indicated).

